Categories: Technical analysis

Facebook Wave Analysis – 5 June, 2020

• Facebook reversed from support area

• Likely to rise to 240.00

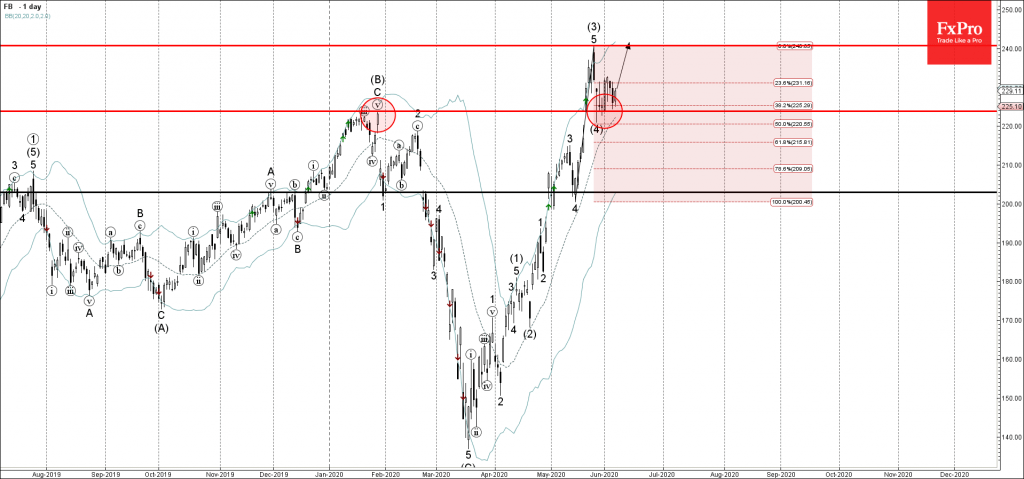
Facebook recently reversed up from the support area lying between the major support level 223.80 (former multi-month resistance from January) and the 38.2% Fibonacci correction of the previous upward impulse 5 from the middle of May.

The upward reversal from this support area started the active medium-term impulse sequence (5).

Facebook is likely to rise further toward the next resistance level 240.00 (top of the previous impulse wave (3)).

The FxPro Tech Analysis Team

The FxPro technical experts prepare a daily analysis of the most active currency pairs (majors, crosses, exotics) and commodities. Selected instruments are reviewed on daily trends (D1, H4), using the active Elliott Wave setups, Japanese candlesticks, indicators, and support/resistance levels.

Share
Published by
The FxPro Tech Analysis Team
Tags: FB

Recent Posts

Solana Wave Analysis – 18 March 2025

Solana: ⬇️ Sell - Solana reversed from the resistance zone - Likely to fall to…

59 minutes ago

CHFJPY Wave Analysis – 18 March 2025

CHFJPY: ⬆️ Buy - CHFJPY broke resistance zone - Likely to rise to resistance level…

1 hour ago

The crypto market is stuck in the mud

Market Picture The crypto market has been hovering in a narrow range for the past…

6 hours ago

FTSE 100 Wave Analysis – 17 March 2025

FTSE 100: ⬆️ Buy - FTSE 100 reversed from key support level 8425.00 - Likely…

22 hours ago

Alibaba Wave Analysis – 17 March 2025

Alibaba: ⬆️ Buy - Alibaba broke the key resistance level 145.00 - Likely to rise…

22 hours ago

EURNZD Wave Analysis – 17 March 2025

EURNZD: ⬇️ Sell - EURNZD reversed from long-term resistance level 1.9160 - Likely to fall…

1 day ago

This website uses cookies