- Facebook reversed from support area
- Likely to rise to 215.00
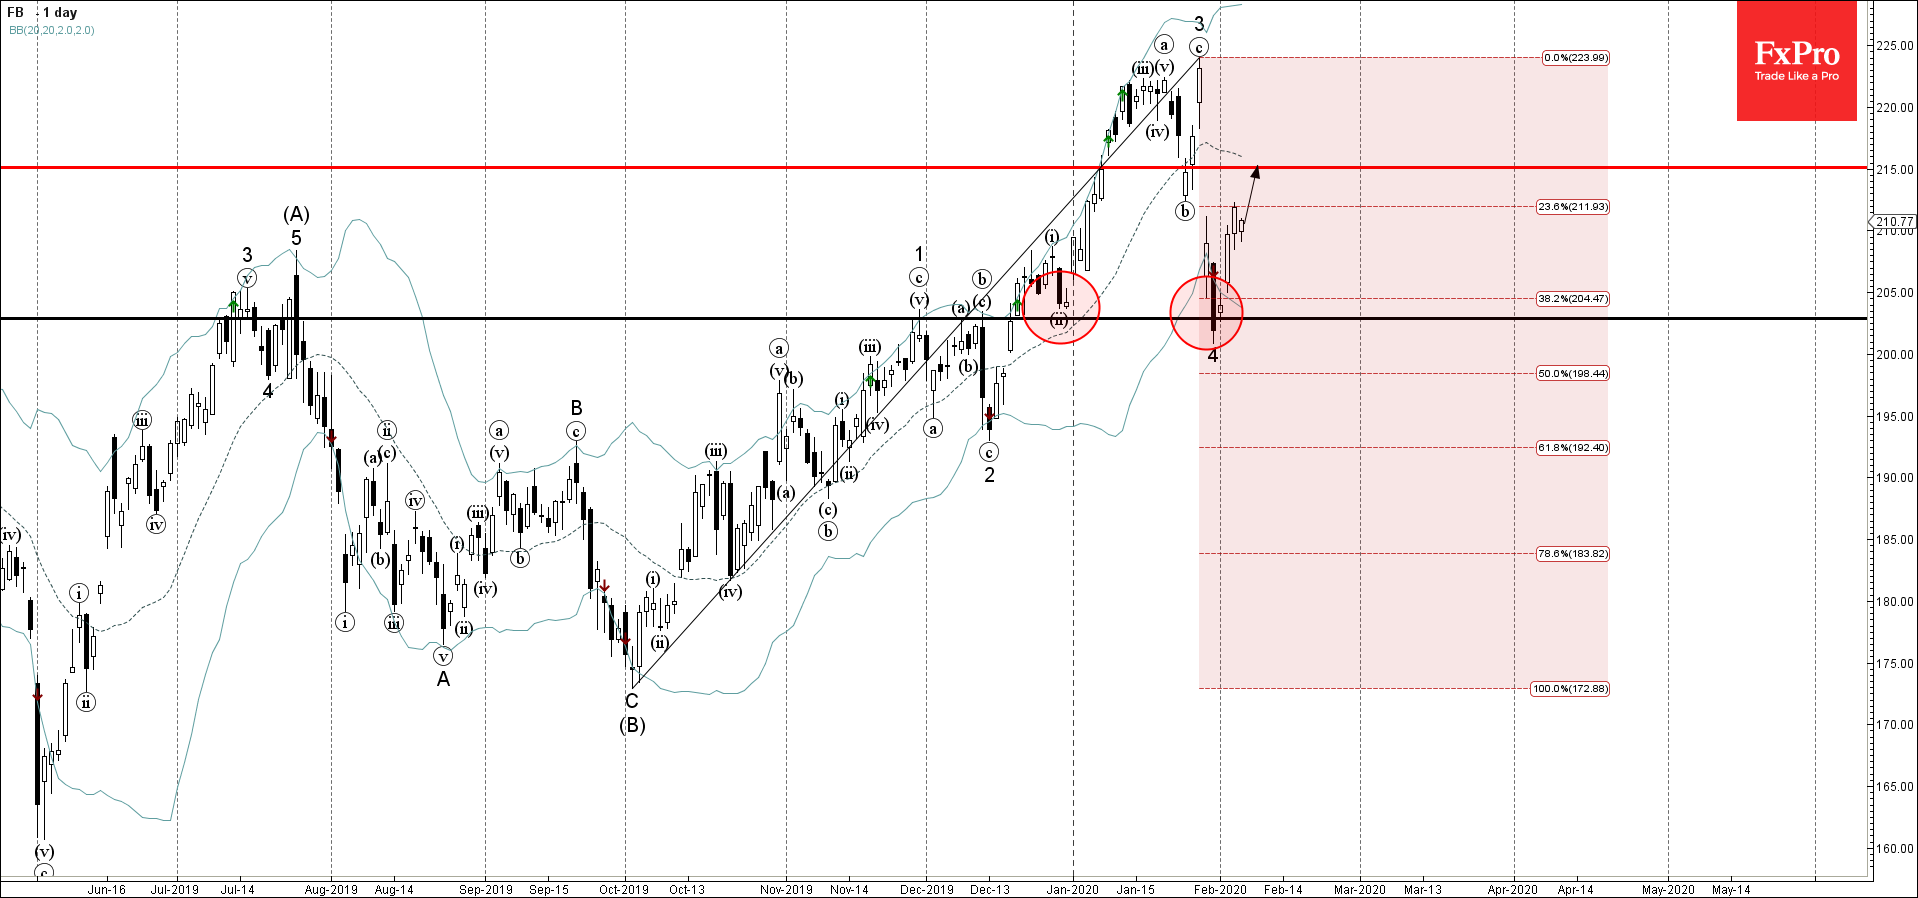
Facebook recently reversed up with the daily Morning Star from the support area lying between the support level 203.00, lower daily Bollinger Band and the 38.2% Fibonacci correction of the pervious impulse wave from October.
The upward reversal from this support area started the active short-term impulse wave 5.
Facebook is likely to rise further toward the next resistance level 215.00 – the breakout of which can lead to further gains toward major resistance level 225.00.