Categories: Technical analysis

ExxonMobil Wave Analysis – 26 January, 2023

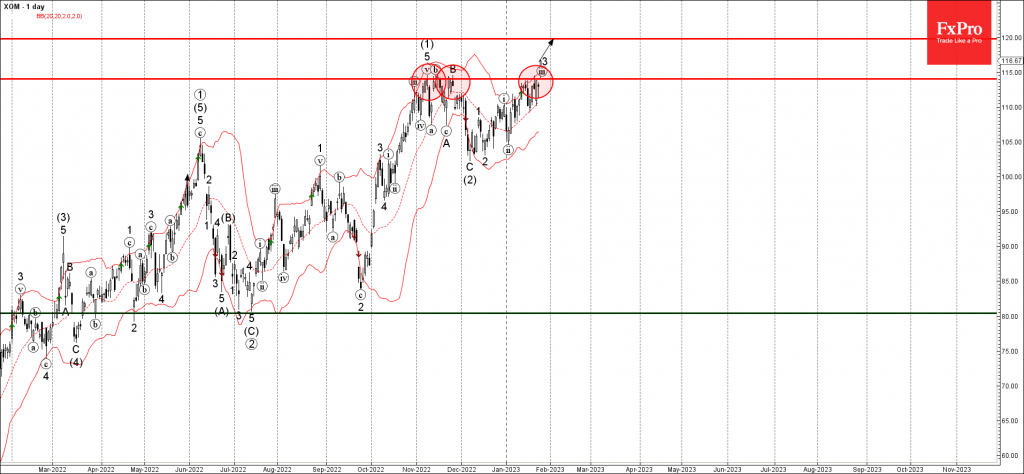
• ExxonMobil broke key resistance level 114.00

• Likely to rise to resistance level 120.00.

ExxonMobil recently broke above the key resistance level 114.00 (which reversed the price multiple times during the last November).

The breakout of the resistance level 114.00 accelerated the active impulse waves (iii) and 3 – which belong to wave (3) from December.

Given the overriding daily uptrend, ExxonMobil can be expected to rise further toward the next resistance level 120.00.

The FxPro Tech Analysis Team

The FxPro technical experts prepare a daily analysis of the most active currency pairs (majors, crosses, exotics) and commodities. Selected instruments are reviewed on daily trends (D1, H4), using the active Elliott Wave setups, Japanese candlesticks, indicators, and support/resistance levels.

Share
Published by
The FxPro Tech Analysis Team
Tags: Exxon

Recent Posts

The yen returned to the Takaichi trade

The dollar resumed its growth after the lawsuit against the Fed chairman. Rumours of early…

1 hour ago

Nat Gas Current situation #tradelikeapro #trading #natgas #tradingstrategy #tradingshorts

Today is Tuesday, the 13th of January, and we will talk about the natural gas…

3 hours ago

Bitcoin Cash Wave Analysis – 12 January 2026

Bitcoin Cash: ⬇️ Sell - Bitcoin Cash reversed from resistance area - Likely to fall…

12 hours ago

EURJPY Wave Analysis – 12 January 2026

EURJPY: ⬆️ Buy - EURJPY reversed from support area - Likely to rise to resistance…

12 hours ago

Gold shines on an anti-fiat thesis

The dollar suffered due to threats to the Fed’s independence. Gold managed to renew its…

22 hours ago

SP500 Current situation #trading #tradelikeapro #sp500 #tradingshorts #tradingstrategy

Today is Monday, the 12th of January, and once again we will talk about the…

23 hours ago

This website uses cookies