Categories: Technical analysis

ExxonMobil Wave Analysis – 09 March, 2020

  • ExxonMobil broke support area
  • Likely to fall to 45.00

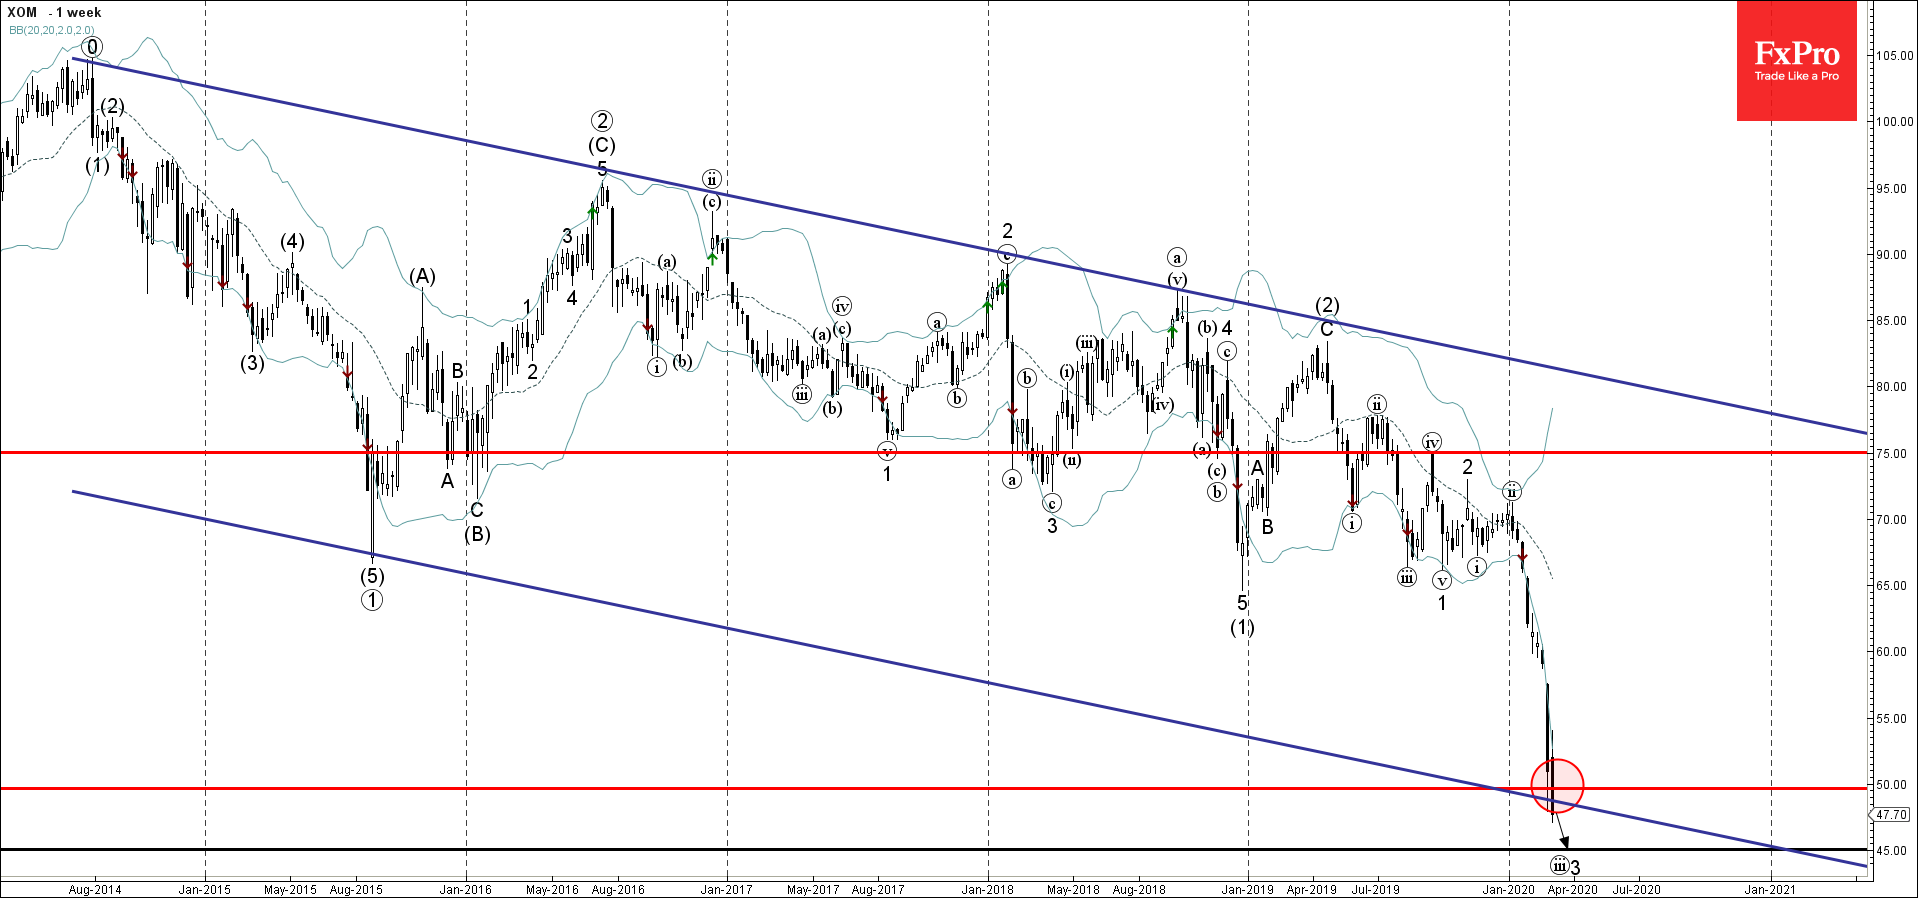
ExxonMobil recently broke through the support area lying between the round support level 50.00 and the support trendline of the wide weekly down channel from 2014.

The breakout of this support area should accelerate the active impulse waves (iii) and 3 – which belong to the multi-month downward impulses sequence (3) from last April.

Given the strength of the active daily downtrend – ExxonMobil is likely to fall further toward the next support level 45.00 (target price for the completion of the active impulse wave 3).


The FxPro Tech Analysis Team

The FxPro technical experts prepare a daily analysis of the most active currency pairs (majors, crosses, exotics) and commodities. Selected instruments are reviewed on daily trends (D1, H4), using the active Elliott Wave setups, Japanese candlesticks, indicators, and support/resistance levels.

Share
Published by
The FxPro Tech Analysis Team
Tags: XOM

Recent Posts

USDJPY Wave Analysis 26 April 2024

- USDJPY broke key resistance level 155.00 - Likely to rise to resistance level 160.00…

1 day ago

Ebay Wave Analysis 26 April 2024

- Ebay reversed from support level 49.35 - Likely to rise to resistance level 52.55…

1 day ago

False Alert with Yen Interventions?

Even though the Bank of Japan left the key rate and parameters of the QE…

1 day ago

Cooler Bitcoin

Market picture  Market Dynamics: The cryptocurrency market stabilised, losing just 0.1% of capitalisation and dropping to…

2 days ago

GBPCAD Wave Analysis 25 April 2024

- GBPCAD reversed from key support level 1.6910 - Likely to rise to resistance level…

2 days ago

GBPAUD Wave Analysis 25 April 2024

- GBPAUD reversed from support level 1.9135 - Likely to rise to resistance level 1.9360…

2 days ago

This website uses cookies