Categories: Technical analysis

Exxon Mobil Wave Analysis – 27 May, 2022

• Exxon Mobil broke the resistance zone
• Likely to rise to resistance level 100.00

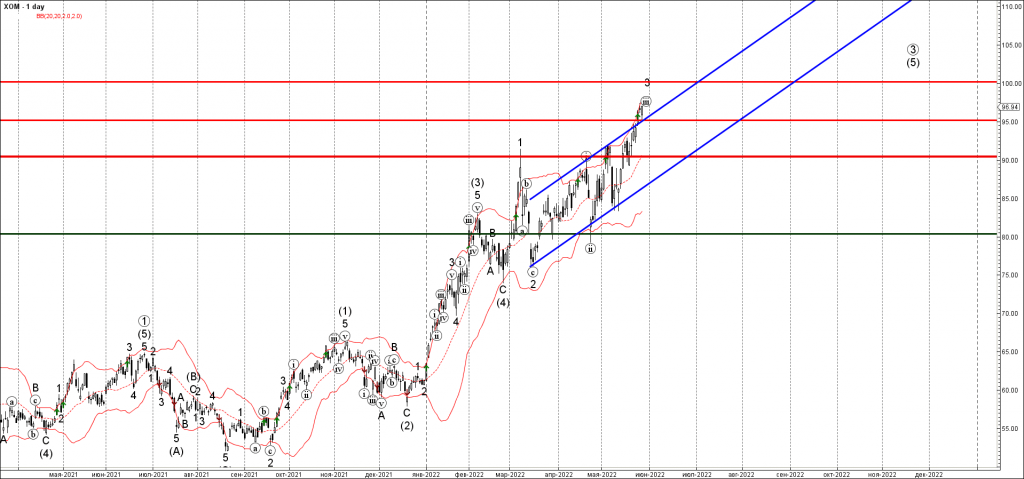
Exxon Mobil recently broke the resistance zone lying at the intersection of the resistance level 95.00 and the resistance trendline of the daily up channel from the middle of March.

The breakout of this resistance zone continues the active minor impulse wave 3 of the intermediate impulse sequence (6) from the end of February.

Given the strong daily uptrend – Exxon Mobil can be expected to rise further toward the next round resistance level 100.00 (target for the completion of the active impulse wave 3).

The FxPro Tech Analysis Team

The FxPro technical experts prepare a daily analysis of the most active currency pairs (majors, crosses, exotics) and commodities. Selected instruments are reviewed on daily trends (D1, H4), using the active Elliott Wave setups, Japanese candlesticks, indicators, and support/resistance levels.

Share
Published by
The FxPro Tech Analysis Team

Recent Posts

ADP hints at another strong NFP on Friday  

The monthly ADP labour market report showed that America created 192K new jobs in April, above…

19 hours ago

Fed’s hawkish tone risks sinking S&P500 to 4700

Bears showed strength ahead of the FOMC decision.  U.S. indices sagged on Tuesday as investors…

22 hours ago

A new stage of Bitcoin’s decline

Market Picture  Bitcoin's closing price on Tuesday became the lowest since late February, confirming the…

1 day ago

Ebay Wave Analysis 30 April 2024

- Ebay under the bearish pressure - Likely to fall to support level 51.00 Ebay…

2 days ago

GBPAUD Wave Analysis 30 April 2024

- GBPAUD reversed from key support level 1.9135 - Likely to rise to resistance level…

2 days ago

Silver: a possible long road down

Silver has lost 2.6% since the start of the day on Tuesday to $26.4 per…

2 days ago

This website uses cookies