Categories: Technical analysis

Exxon Mobil Wave Analysis 19 October, 2020

• Exxon Mobil falling inside impulse wave (3)

• Likely to fall to 33.20

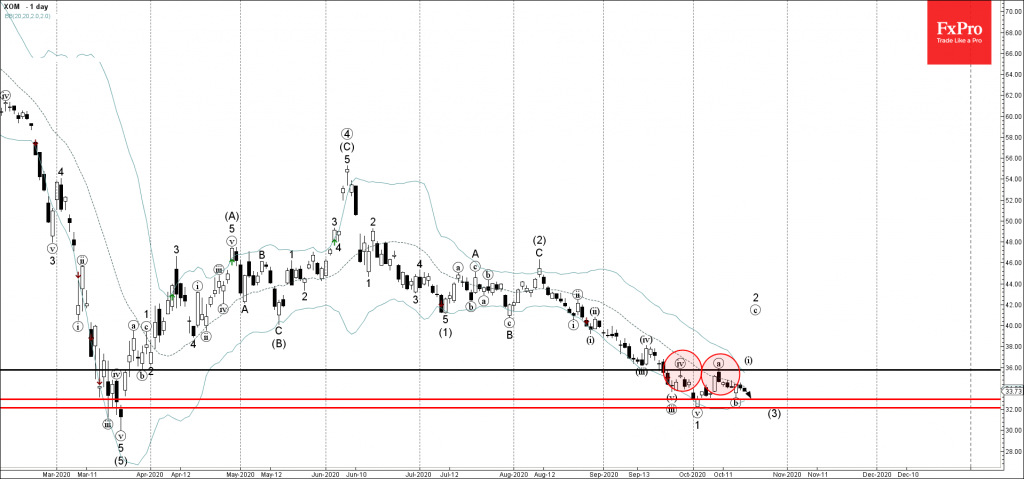
Exxon Mobil continues to fall inside the intermediate downward impulse (3) – which previously reversed down from the resistance level 36.00 (which also stopped the previous minor correction (iv) in September).

The active impulse wave (3) belongs to the higher-order multi-month downward impulse sequence ⑤ from June.

Exxon Mobil is likely fall further toward the next support level 33.20 – followed by 32.00 (low of the previous impulse wave 1 from the start of October).

The FxPro Tech Analysis Team

The FxPro technical experts prepare a daily analysis of the most active currency pairs (majors, crosses, exotics) and commodities. Selected instruments are reviewed on daily trends (D1, H4), using the active Elliott Wave setups, Japanese candlesticks, indicators, and support/resistance levels.

Share
Published by
The FxPro Tech Analysis Team
Tags: XOM

Recent Posts

ANF Wave Analysis 29 April 2024

ANF reversed from key support level 113.40 Likely to rise to resistance level 132.31 ANF…

7 hours ago

GBPUSD Wave Analysis 29 April 2024

- GBPUSD rising inside minor correction 2 - Likely to rise to resistance level 1.2700…

7 hours ago

Crypto Market Retreats Due to Overhang of Sellers

Market picture The crypto market has lost 3.3% in the last 24 hours to $2.3…

17 hours ago

USDJPY Wave Analysis 26 April 2024

- USDJPY broke key resistance level 155.00 - Likely to rise to resistance level 160.00…

3 days ago

Ebay Wave Analysis 26 April 2024

- Ebay reversed from support level 49.35 - Likely to rise to resistance level 52.55…

3 days ago

False Alert with Yen Interventions?

Even though the Bank of Japan left the key rate and parameters of the QE…

4 days ago

This website uses cookies