Categories: Technical analysis

Exxon Mobil Wave Analysis 15 October 2024

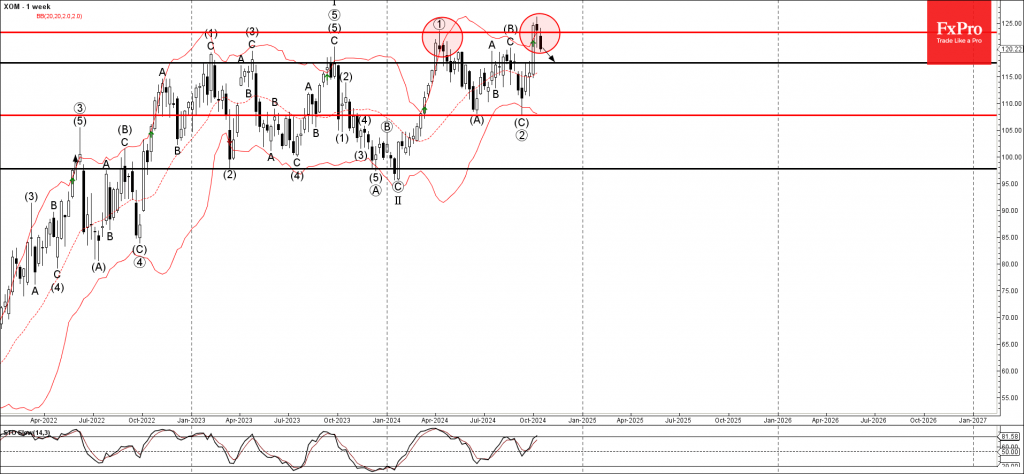
– Exxon Mobil reversed from the resistance zone

– Likely to fall to support level 117.55

Exxon Mobil recently reversed from the resistance zone between the pivotal resistance level 123.25 (former monthly high from April) and the upper weekly Bollinger Band.

The downward reversal from this resistance zone created the weekly Japanese candlesticks reversal pattern long-legged Doji.

Given the strength of the resistance level 123.25 and the overbought daily Stochastic, Exxon Mobil can be expected to fall further to the next support level 117.55 (former resistance from September).

The FxPro Tech Analysis Team

The FxPro technical experts prepare a daily analysis of the most active currency pairs (majors, crosses, exotics) and commodities. Selected instruments are reviewed on daily trends (D1, H4), using the active Elliott Wave setups, Japanese candlesticks, indicators, and support/resistance levels.

Share
Published by
The FxPro Tech Analysis Team
Tags: Exxon

Recent Posts

The Crypto Market Is Trying to Form an Uptrend

The crypto market is attempting to form an upward trend, with the market capitalization growing…

27 mins ago

EURJPY Wave Analysis 15 October 2024

- EURJPY reversed from the resistance zone - Likely to fall to support level 160.90…

12 hours ago

Soaring bitcoin

The crypto market reached $2.28 trillion, with Bitcoin trading above $66.5K. Chinese stimulus measures and…

19 hours ago

Fall in Unemployment Supports Pound, But Concerns Grow

The UK unemployment rate dropped to a record low, supporting the pound. However, there are…

22 hours ago

Weak Swiss Inflation Pressures Franc Outlook

Swiss inflation continues to disappoint, with producer and import prices falling by 0.1% m/m in…

1 day ago

S&P 500 index Wave Analysis 14 October 2024

- S&P 500 index broke resistance level 5785.00 - Likely to rise to resistance level…

2 days ago

This website uses cookies