Categories: Technical analysis

Exxon Mobil Wave Analysis – 15 December 2025

Exxon Mobil: ⬇️ Sell

– Exxon Mobil reversed from resistance area

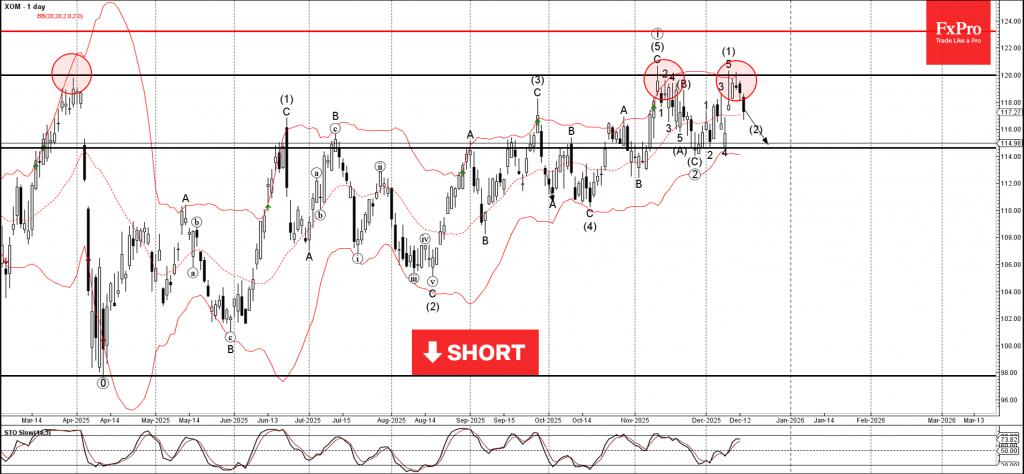
– Likely to fall to support level 115.00

Exxon Mobil recently reversed down from the resistance area between the key resistance level 120.00 (which has been reversing the price from March) and the upper daily Bollinger Band.

The downward reversal from the resistance level 120.00 started the active intermediate correction (2).

Given the strength of the resistance level 120.00, Exxon Mobil can be expected to fall to the next support level 115.00 (low of the previous waves (C), 2 and 4).

The FxPro Tech Analysis Team

The FxPro technical experts prepare a daily analysis of the most active currency pairs (majors, crosses, exotics) and commodities. Selected instruments are reviewed on daily trends (D1, H4), using the active Elliott Wave setups, Japanese candlesticks, indicators, and support/resistance levels.

Share
Published by
The FxPro Tech Analysis Team
Tags: Exxon

Recent Posts

NZDCAD Wave Analysis – 7 January 2026

NZDCAD: ⬆️ Buy - NZDCAD reversed from support zone - Likely to rise to resistance…

7 hours ago

Bitcoin Wave Analysis – 7 January 2026

Bitcoin: ⬇️ Sell - Bitcoin reversed from resistance zone - Likely to fall to support…

7 hours ago

EURGBP Wave Analysis – 7 January 2026

EURGBP: ⬆️ Buy - EURGBP reversed from support zone - Likely to rise to resistance…

7 hours ago

Brent Crude Oil Wave Analysis – 7 January 2026

Brent Crude Oil: ⬇️ Sell - Brent Crude Oil reversed from resistance zone - Likely…

7 hours ago

Old fears about the euro have returned

The resurgence of the political crisis in France is weighing on EURUSD The US dollar…

17 hours ago

The crypto market has hit the upper limit of its rebound

The crypto market faces resistance at $3.2T; sentiment rises, but selling pressure persists. Bitcoin and…

19 hours ago

This website uses cookies