Categories: Technical analysis

Exxon Mobil Wave Analysis – 08 November, 2019

  • Exxon Mobil broke resistance area
  • Likely to rise to 75.00

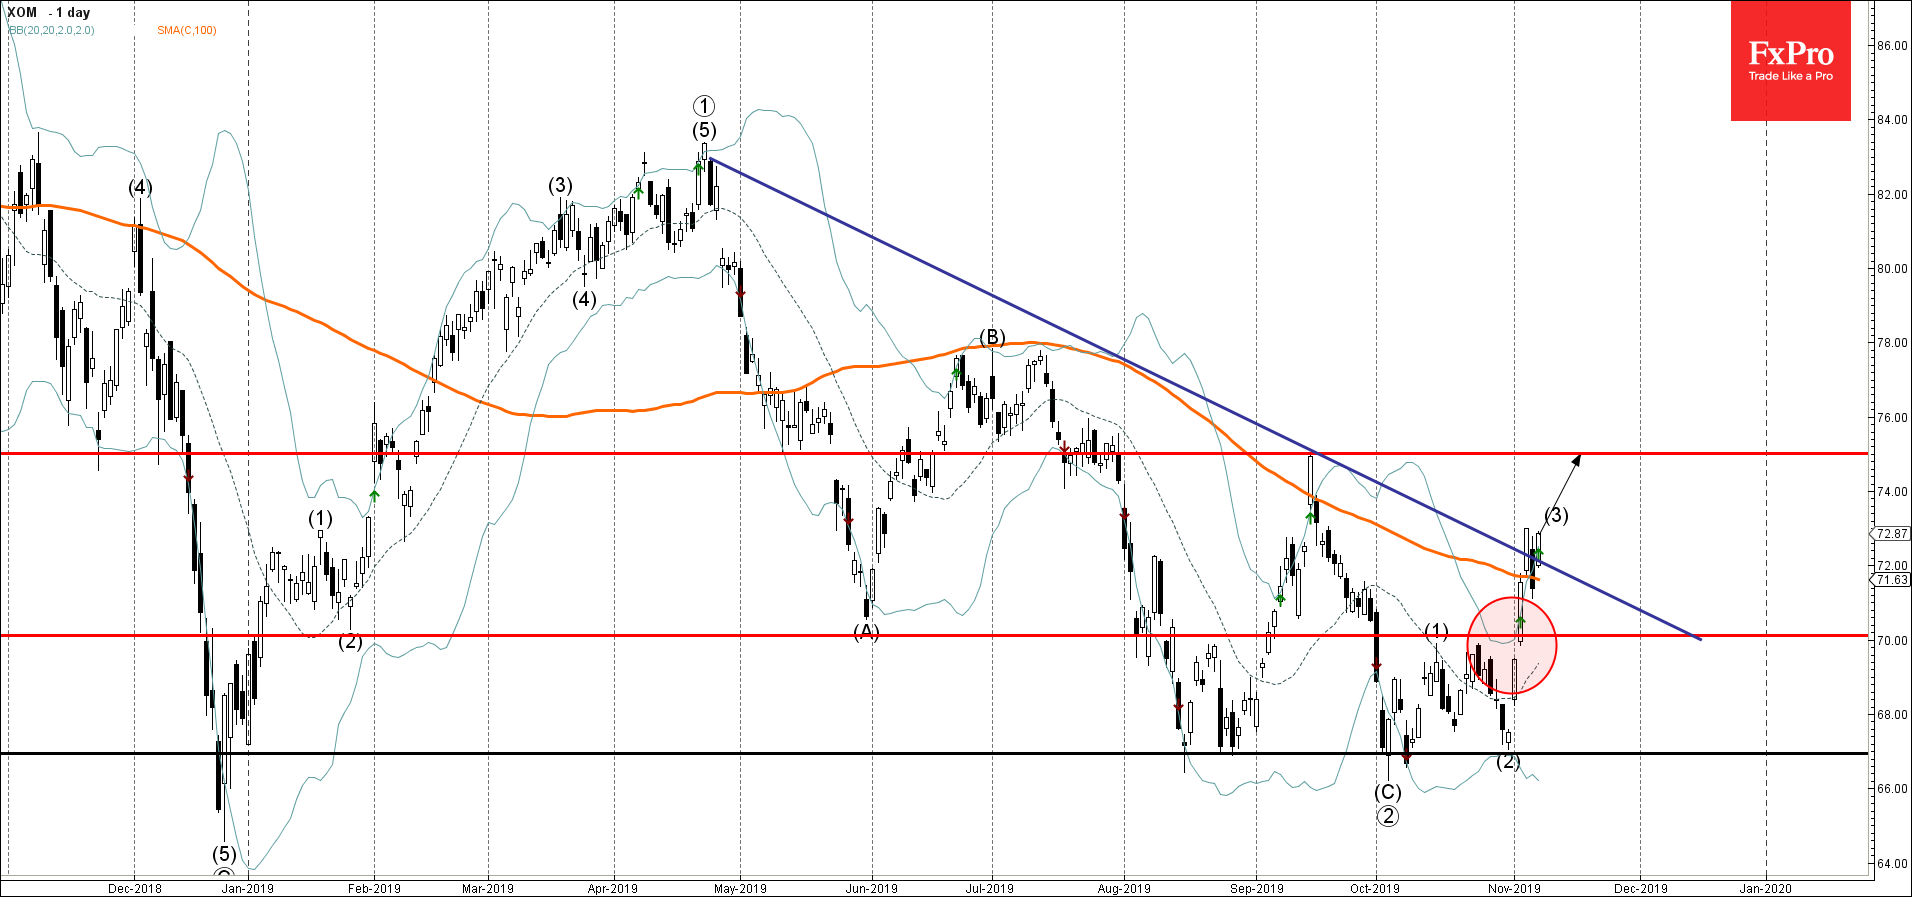
Exxon Mobil has been under bullish pressure after the earlier breakout of the resistance level 70.00 (previous upward target).

The price earlier broke the resistance area lying between the resistance trendline from April and the 100-day moving average – which accelerated the active impulse wave (3).

Exxon Mobil is expected to rise further and retest the next strong resistance level 75.00 – which is the monthly high from September.

The FxPro Tech Analysis Team

The FxPro technical experts prepare a daily analysis of the most active currency pairs (majors, crosses, exotics) and commodities. Selected instruments are reviewed on daily trends (D1, H4), using the active Elliott Wave setups, Japanese candlesticks, indicators, and support/resistance levels.

Share
Published by
The FxPro Tech Analysis Team
Tags: XOM

Recent Posts

Ebay Wave Analysis 30 April 2024

- Ebay under the bearish pressure - Likely to fall to support level 51.00 Ebay…

10 hours ago

GBPAUD Wave Analysis 30 April 2024

- GBPAUD reversed from key support level 1.9135 - Likely to rise to resistance level…

10 hours ago

Silver: a possible long road down

Silver has lost 2.6% since the start of the day on Tuesday to $26.4 per…

13 hours ago

Another Dip in Crypto Capitalization

Market picture  The crypto market capitalisation decreased by another 1.5% to $2.27 trillion, getting closer…

16 hours ago

ANF Wave Analysis 29 April 2024

ANF reversed from key support level 113.40 Likely to rise to resistance level 132.31 ANF…

1 day ago

GBPUSD Wave Analysis 29 April 2024

- GBPUSD rising inside minor correction 2 - Likely to rise to resistance level 1.2700…

1 day ago

This website uses cookies