Categories: Technical analysis

EURUSD Wave Analysis – June 6, 2018

• EUR/USD broke resistance zone • Further gains are likely

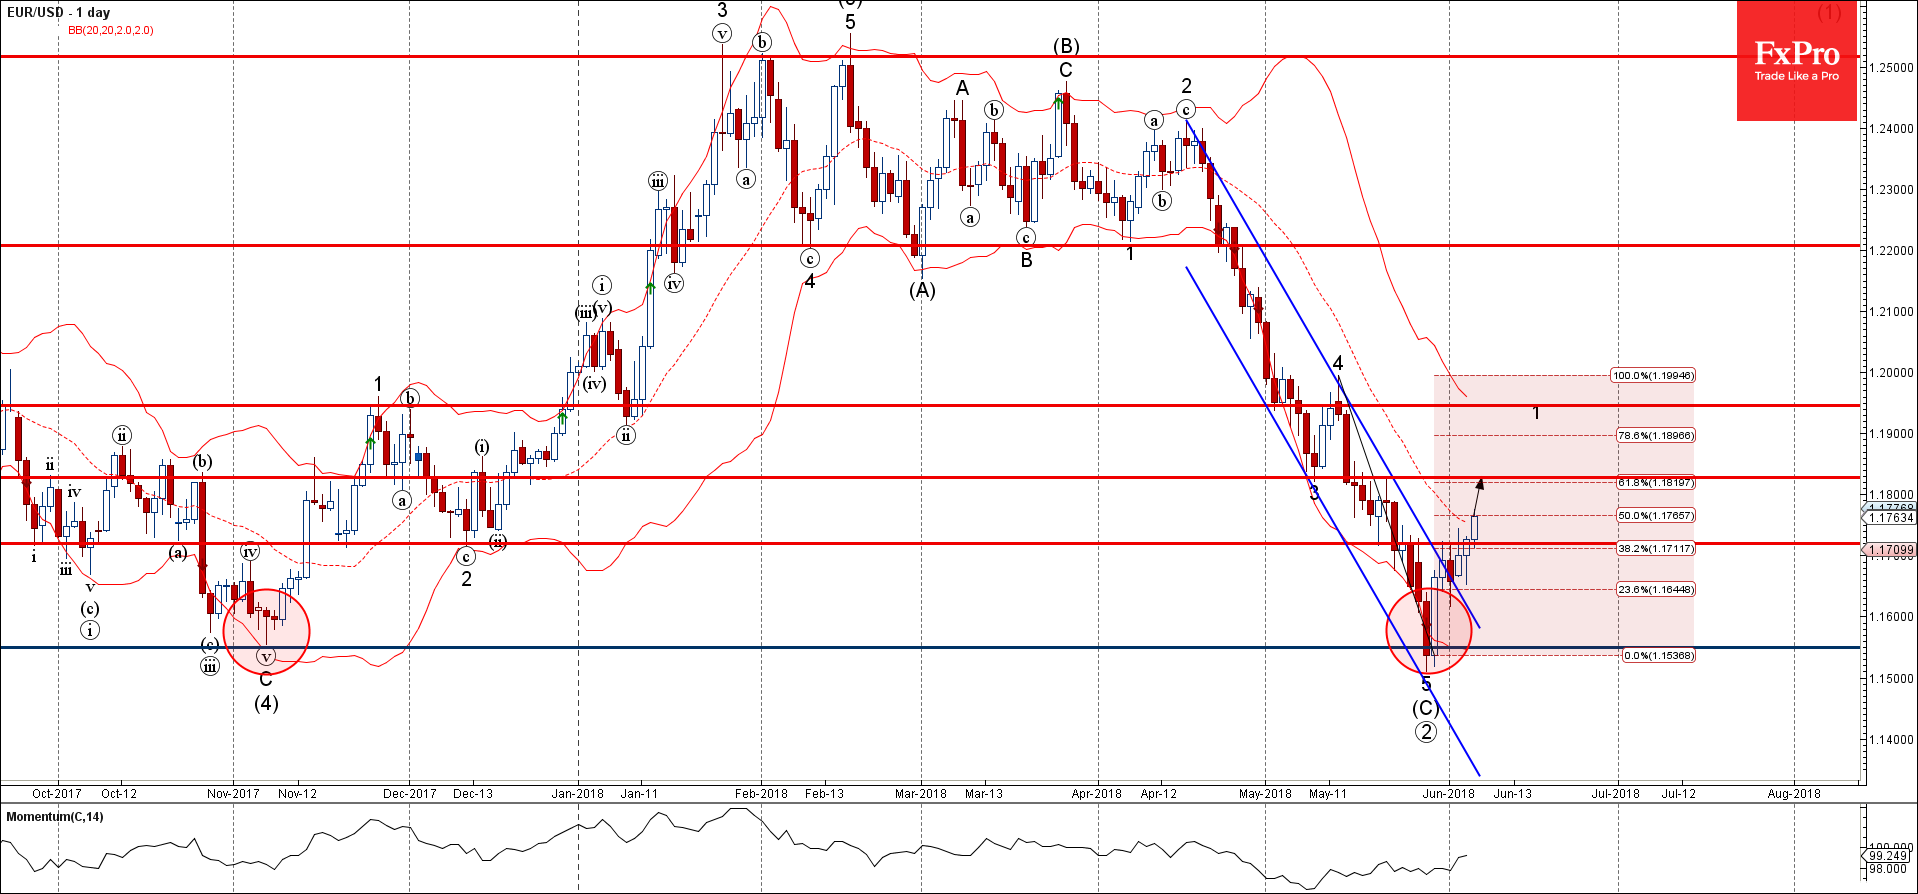
EUR/USD recently broke the resistance zone lying between the resistance level 1.1720, resistance trendline of the daily down channel from April and the 38.2% Fibonacci correction of the previous downward impulse from the middle of April.

The breakout of this resistance zone should strengthen the active primary impulse wave ③, which started earlier from the long-term support level 1.1550.

With the rising daily Momentum, EUR/USD is expected to rise further and re-test the next resistance level 1.1830 (former support level which stopped the previous minor impulse wave 3 in May).

The FxPro Analyst Team

Our team consists of financial market experts. Our dedicated professionals prepare reviews on the foreign exchange market situation, Crude Oil, Gold and Stock Indices. All the analysts are regularly published in the world leading economic media.

Share
Published by
The FxPro Analyst Team
Tags: EURUSD

Recent Posts

EURJPY Wave Analysis 2 May 2024

- EURJPY under strong bearish pressure - Likely to fall to support level 163.10 EURJPY…

4 hours ago

WTI crude oil Wave Analysis 2 May 2024

- WTI broke round support level 80.00 - Likely to fall to support level 76.00…

4 hours ago

ADP hints at another strong NFP on Friday

The monthly ADP labour market report showed that America created 192K new jobs in April, above…

1 day ago

Fed’s hawkish tone risks sinking S&P500 to 4700

Bears showed strength ahead of the FOMC decision.  U.S. indices sagged on Tuesday as investors…

1 day ago

A new stage of Bitcoin’s decline

Market Picture  Bitcoin's closing price on Tuesday became the lowest since late February, confirming the…

2 days ago

Ebay Wave Analysis 30 April 2024

- Ebay under the bearish pressure - Likely to fall to support level 51.00 Ebay…

2 days ago

This website uses cookies