Categories: Technical analysis

EURUSD Wave Analysis – 5 March 2025

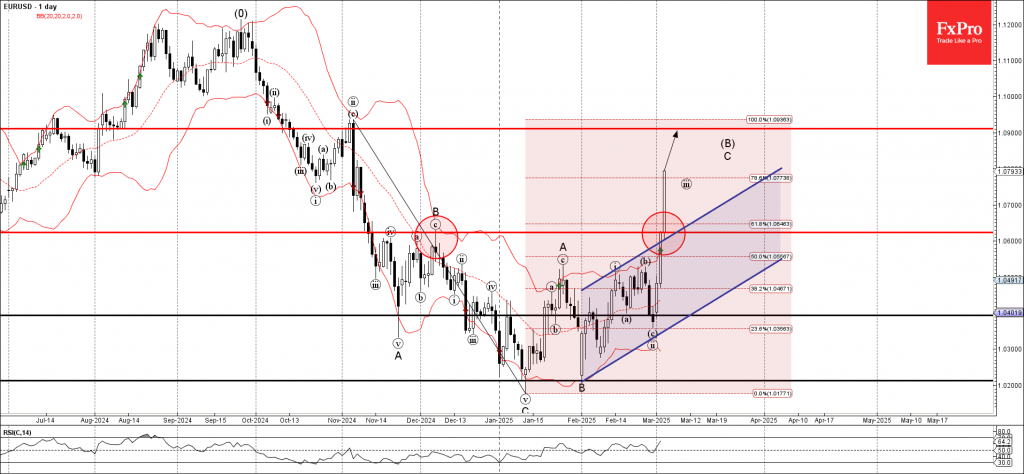
– EURUSD broke the resistance zone

– Likely to rise to resistance level 1.0900

EURUSD currency pair recently broke the resistance zone between the resistance level 1.0625 (former monthly high from December), 61.8% Fibonacci correction of the downward impulse from November and the resistance trendline of the daily up channel from January.

The breakup of this resistance zone accelerated the active impulse wave C of the medium-term ABC correction B from January.

Given the strongly bearish US dollar sentiment, EURUSD can be expected to rise toward the next resistance level 1.0900, the target price for the completion of the active impulse wave C.

AddThis Website Tools
The FxPro Tech Analysis Team

The FxPro technical experts prepare a daily analysis of the most active currency pairs (majors, crosses, exotics) and commodities. Selected instruments are reviewed on daily trends (D1, H4), using the active Elliott Wave setups, Japanese candlesticks, indicators, and support/resistance levels.

Share
Published by
The FxPro Tech Analysis Team
Tags: EURUSD

Recent Posts

Bitcoin Wave Analysis – 22 April 2025

Bitcoin: ⬆️ Buy - Bitcoin broke round resistance level 90000.00 - Likely to rise to…

8 hours ago

AUDUSD Wave Analysis – 22 April 2025

AUDUSD: ⬇️ Sell - AUDUSD reversed from the key resistance level 0.6400 - Likely to…

8 hours ago

Crypto Market Escapes from Fear

Market Overview The crypto market has gained around 2% over the past seven days, with…

20 hours ago

Nike Wave Analysis – 21 April 2025

Nike: ⬆️ Buy - Nike reversed from the long-term support level 52.60 - Likely to…

1 day ago

Natural Gas Wave Analysis – 21 April 2025

Natural gas: ⬇️ Sell Natural gas broke support area Likely to fall to support level…

1 day ago

EURUSD Wave Analysis – 21 April 2025

EURUSD: ⬆️ Buy - EURUSD broke the resistance area - Likely to test resistance level…

1 day ago