Categories: Technical analysis

EURUSD Wave Analysis 5 March, 2021

• EURUSD broke key support level 1.1960

• Likely to fall to support level 1.1800

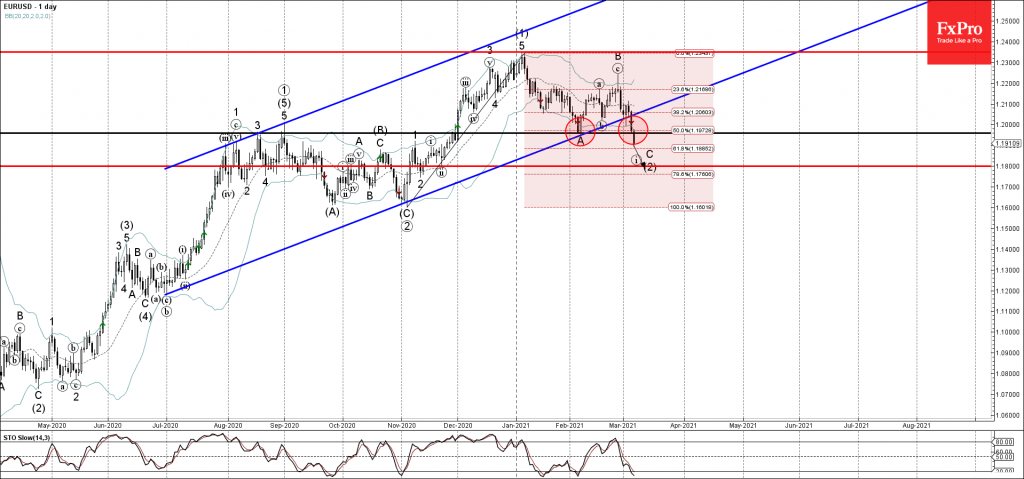
EURUSD recently broke the key support level 1.1960 (which stopped the A-wave of the active ABC correction (2) in February).

The breakout of the support level 1.1960 coincided with the breakout of the 50% Fibonacci correction of the earlier upward impulse (1) from November.

EURUSD is likely to fall further toward the next support 1.1800 (target price for the completion of the active ABC correction (2)).

The FxPro Tech Analysis Team

The FxPro technical experts prepare a daily analysis of the most active currency pairs (majors, crosses, exotics) and commodities. Selected instruments are reviewed on daily trends (D1, H4), using the active Elliott Wave setups, Japanese candlesticks, indicators, and support/resistance levels.

Share
Published by
The FxPro Tech Analysis Team
Tags: EURUSD

Recent Posts

Adobe Wave Analysis 3 May 2024

- Adobe reversed from support zone - Likely to rise to resistance level 500.00 Adobe…

1 day ago

EURGBP Wave Analysis 3 May 2024

- EURJPY reversed from support zone - Likely to rise to resistance level 0.8625 EURGBP…

1 day ago

How Low Can the USDJPY Go?

USDJPY was slipping below 153 on Friday morning, a three-week low and having lost over…

1 day ago

Bitcoin’s Downtrend, Solana and Ethereum Form Double Bottom

Market picture  Crypto market capitalisation rose 3.3% in 24 hours to $2.22 trillion. Local capitalisation…

2 days ago

EURJPY Wave Analysis 2 May 2024

- EURJPY under strong bearish pressure - Likely to fall to support level 163.10 EURJPY…

2 days ago

WTI crude oil Wave Analysis 2 May 2024

- WTI broke round support level 80.00 - Likely to fall to support level 76.00…

2 days ago

This website uses cookies