Categories: Technical analysis

EURUSD Wave Analysis 3 April 2024

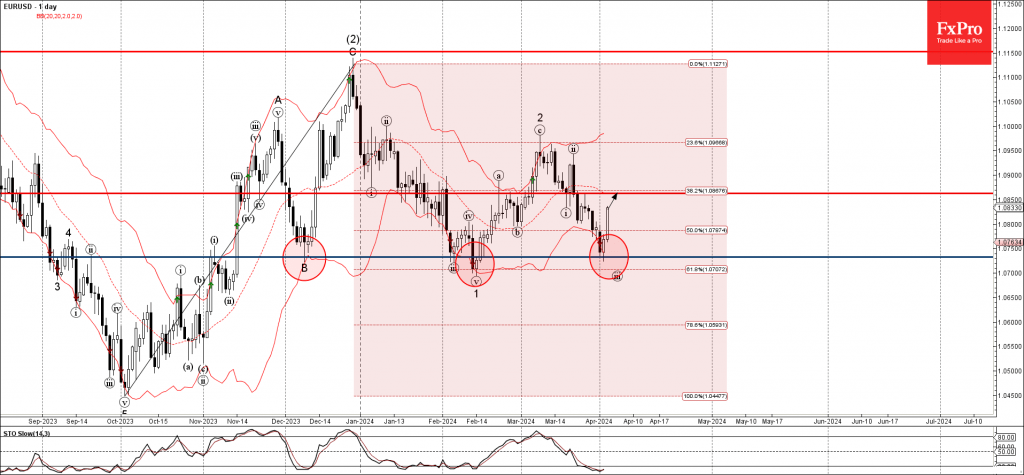
– EURUSD reversed from key support level 1.0730

– Likely to rise to resistance level 1.0860

EURUSD currency pair recently reversed up from the key support level 1.0730, which has been reversing the pair from the start of December, standing near the lower daily Bollinger Band and the 61.8% Fibonacci correction of the upward impulse from October

The upward reversal from the support level 1.0730 created the daily Japanese candlesticks reversal pattern Piercing Line.

Given the oversold daily Stochastic, EURUSD currency pair can be expected to rise further to the next resistance level 1.0860.

The FxPro Tech Analysis Team

The FxPro technical experts prepare a daily analysis of the most active currency pairs (majors, crosses, exotics) and commodities. Selected instruments are reviewed on daily trends (D1, H4), using the active Elliott Wave setups, Japanese candlesticks, indicators, and support/resistance levels.

Share
Published by
The FxPro Tech Analysis Team
Tags: EURUSD

Recent Posts

EURCAD Wave Analysis 6 September 2024

- EURCAD reversed from pivotal support level 1.4900 - Likely to rise to resistance level…

1 day ago

EURUSD Wave Analysis 6 September 2024

- EURUSD reversed from support level 1.1030 - Likely to rise to resistance level 1.1200…

1 day ago

Further Unwinding of Carry Trade

The unwinding of the carry trade in the FX market continues, with the major safe…

1 day ago

Bitcoin pressured by risk-off mood

Market Picture The pressure on risk assets continues, pushing the crypto market capitalisation back below…

2 days ago

AUDUSD Wave Analysis 5 September 2024

- AUDUSD reversed from support level 0.6700 - Likely to rise to resistance level 0.6800…

2 days ago

Gold Wave Analysis 5 September 2024

- Gold reversed from support level 2475.00 - Likely to rise to resistance level 2535.00…

2 days ago

This website uses cookies