Categories: Technical analysis

EURUSD Wave Analysis – 28 August 2025

EURUSD: ⬆️ Buy

– EURUSD reversed from support zone

– Likely to rise to resistance level 1.1755

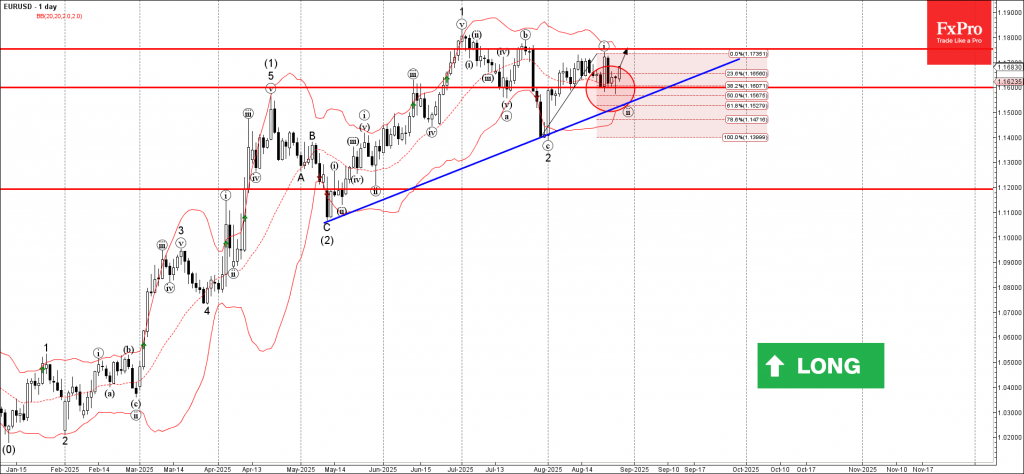
EURUSD currency pair recently reversed from the support zone between the strong support level 1.1600 (which has been reversing the price from the start of August), 20-day moving average and the 38.2% Fibonacci correction of the upward impulse from July.

The upward reversal from this support zone created the daily Japanese candlesticks reversal pattern Hammer Doji.

Given the clear daily uptrend and the strongly bearish US dollar sentiment, EURUSD currency pair can be expected to rise to the next resistance level 1.1755 (which has been reversing the price from the start of July).

The FxPro Tech Analysis Team

The FxPro technical experts prepare a daily analysis of the most active currency pairs (majors, crosses, exotics) and commodities. Selected instruments are reviewed on daily trends (D1, H4), using the active Elliott Wave setups, Japanese candlesticks, indicators, and support/resistance levels.

Share
Published by
The FxPro Tech Analysis Team
Tags: EURUSD

Recent Posts

CADJPY Wave Analysis – 26 December 2025

CADJPY: ⬆️ Buy - CADJPY broke resistance level 114.30 - Likely to rise to resistance…

11 hours ago

Toncoin Wave Analysis – 26 December 2025

Toncoin: ⬆️ Buy - Toncoin reversed from support zone - Likely to rise to resistance…

11 hours ago

Nvidia Wave Analysis – 26 December 2025

Nvidia: ⬆️ Buy - Nvidia reversed from support zone - Likely to rise to resistance…

11 hours ago

Palladium Wave Analysis – 26 December 2025

Palladium: ⬆️ Buy - Palladium reversed from support zone - Likely to rise to resistance…

11 hours ago

AUDUSD Wave Analysis – 24 December 2025

AUDUSD: ⬆️ Buy - AUDUSD broke key resistance level 0.6690 - Likely to rise to…

3 days ago

Tron Wave Analysis – 24 December 2025

Tron: ⬇️ Sell - Tron reversed from resistance zone - Likely to fall to support…

3 days ago

This website uses cookies