Categories: Technical analysis

EURUSD Wave Analysis – 27 January, 2020

  • EURUSD broke support area
  • Likely to fall to 1.100

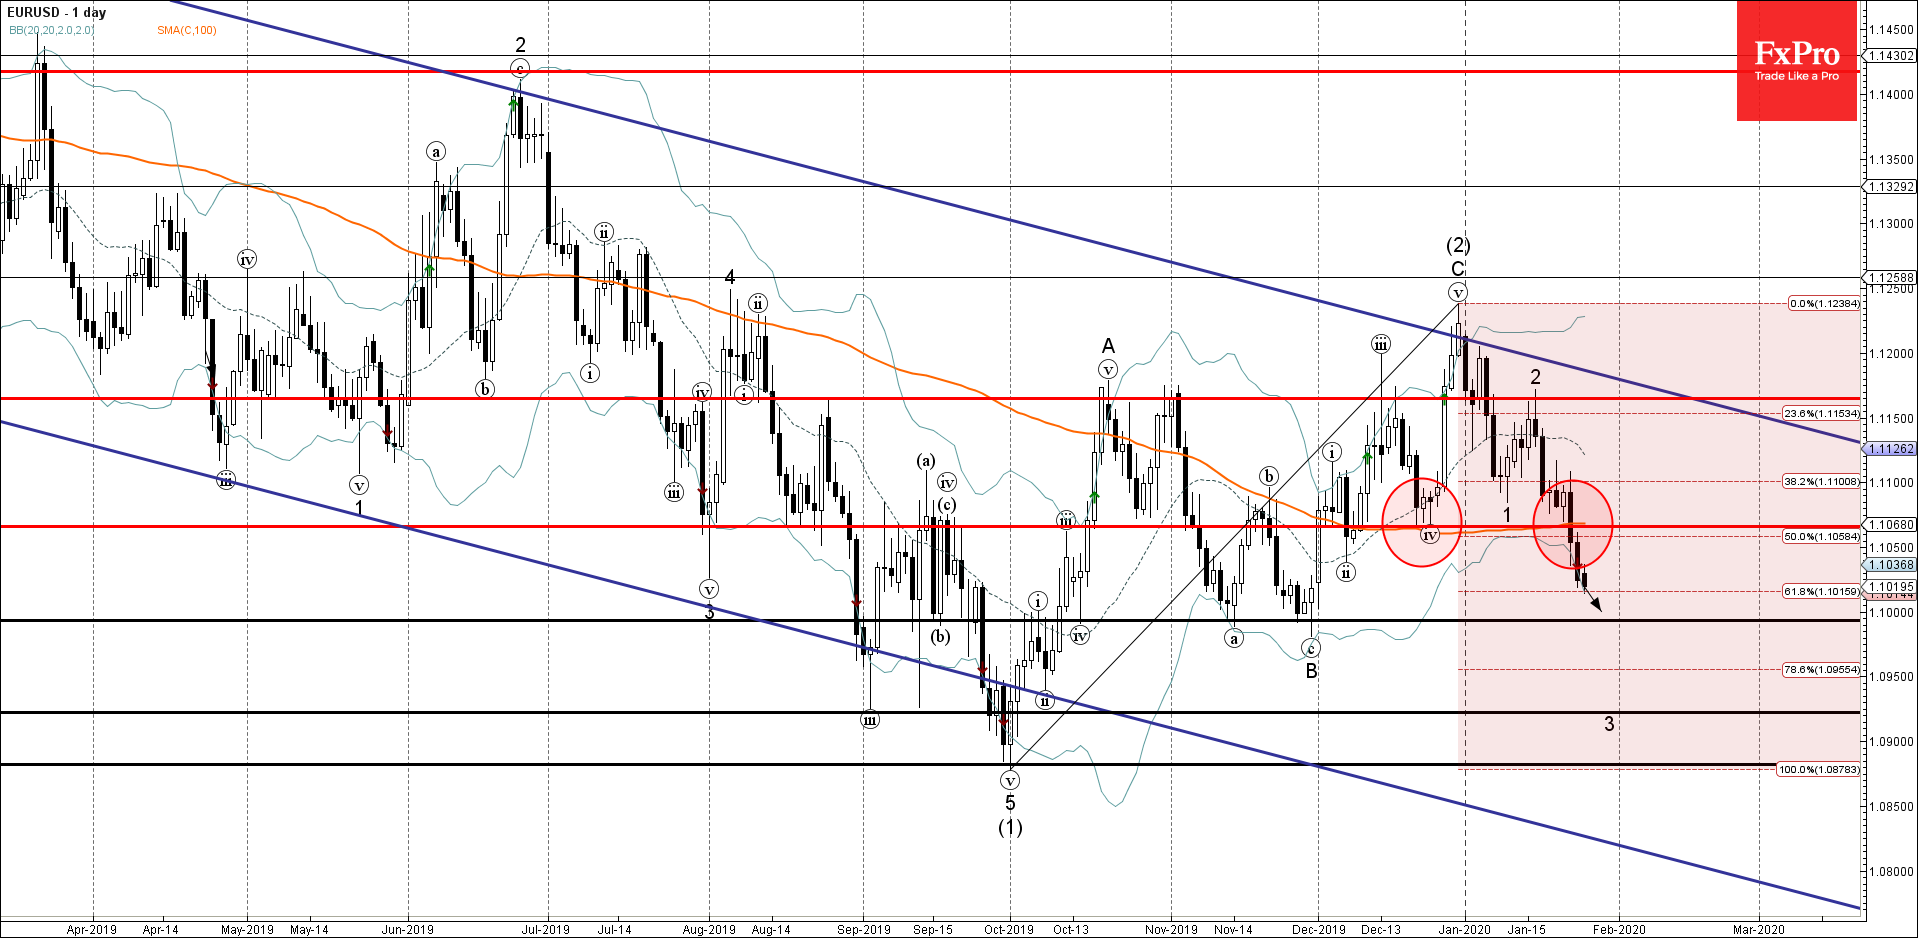
EURUSD under bearish pressure after the earlier breakout of the support area lying between the support level 1.1060 (which reversed the price twice in December) and the 50% Fibonacci correction of the previous upward ABC correction (2) from September.

The breakout of this support area accelerated the active impulse waves 3 and (3).

EURUSD is likely to fall further toward the next support level 1.100 (former double bottom from November).

AddThis Website Tools
The FxPro Tech Analysis Team

The FxPro technical experts prepare a daily analysis of the most active currency pairs (majors, crosses, exotics) and commodities. Selected instruments are reviewed on daily trends (D1, H4), using the active Elliott Wave setups, Japanese candlesticks, indicators, and support/resistance levels.

Share
Published by
The FxPro Tech Analysis Team
Tags: EURUSD

Recent Posts

Apple Wave Analysis – 20 March 2025

Apple: ⬇️ Sell - Apple reversed from resistance level 220.00 - Likely to fall to…

14 hours ago

IBM Wave Analysis – 20 March 2025

IBM: ⬆️ Buy - IBM reversed from support zone - Likely to rise to resistance…

14 hours ago

AUDNZD Wave Analysis – 20 March 2025

AUDNZD: ⬆️ Buy - AUDNZD reversed from key support level 1.0930 - Likely to rise…

16 hours ago

EURCAD Wave Analysis – 20 March 2025

EURCAD: ⬇️ Sell - EURCAD reversed from the resistance zone - Likely to fall to…

16 hours ago

Crypto Market Testing Resistance

The crypto market has increased by over 5% and is nearing the $2.9 trillion. The…

21 hours ago

Gold Wave Analysis – 19 March 2025

Gold: ⬆️ Buy - Gold continues daily uptrend - Likely to rise to resistance level…

1 day ago