Categories: Technical analysis

EURUSD Wave Analysis – 26 March, 2020

  • EURUSD reversed from combined support zone
  • Likely to rise to 1.1200

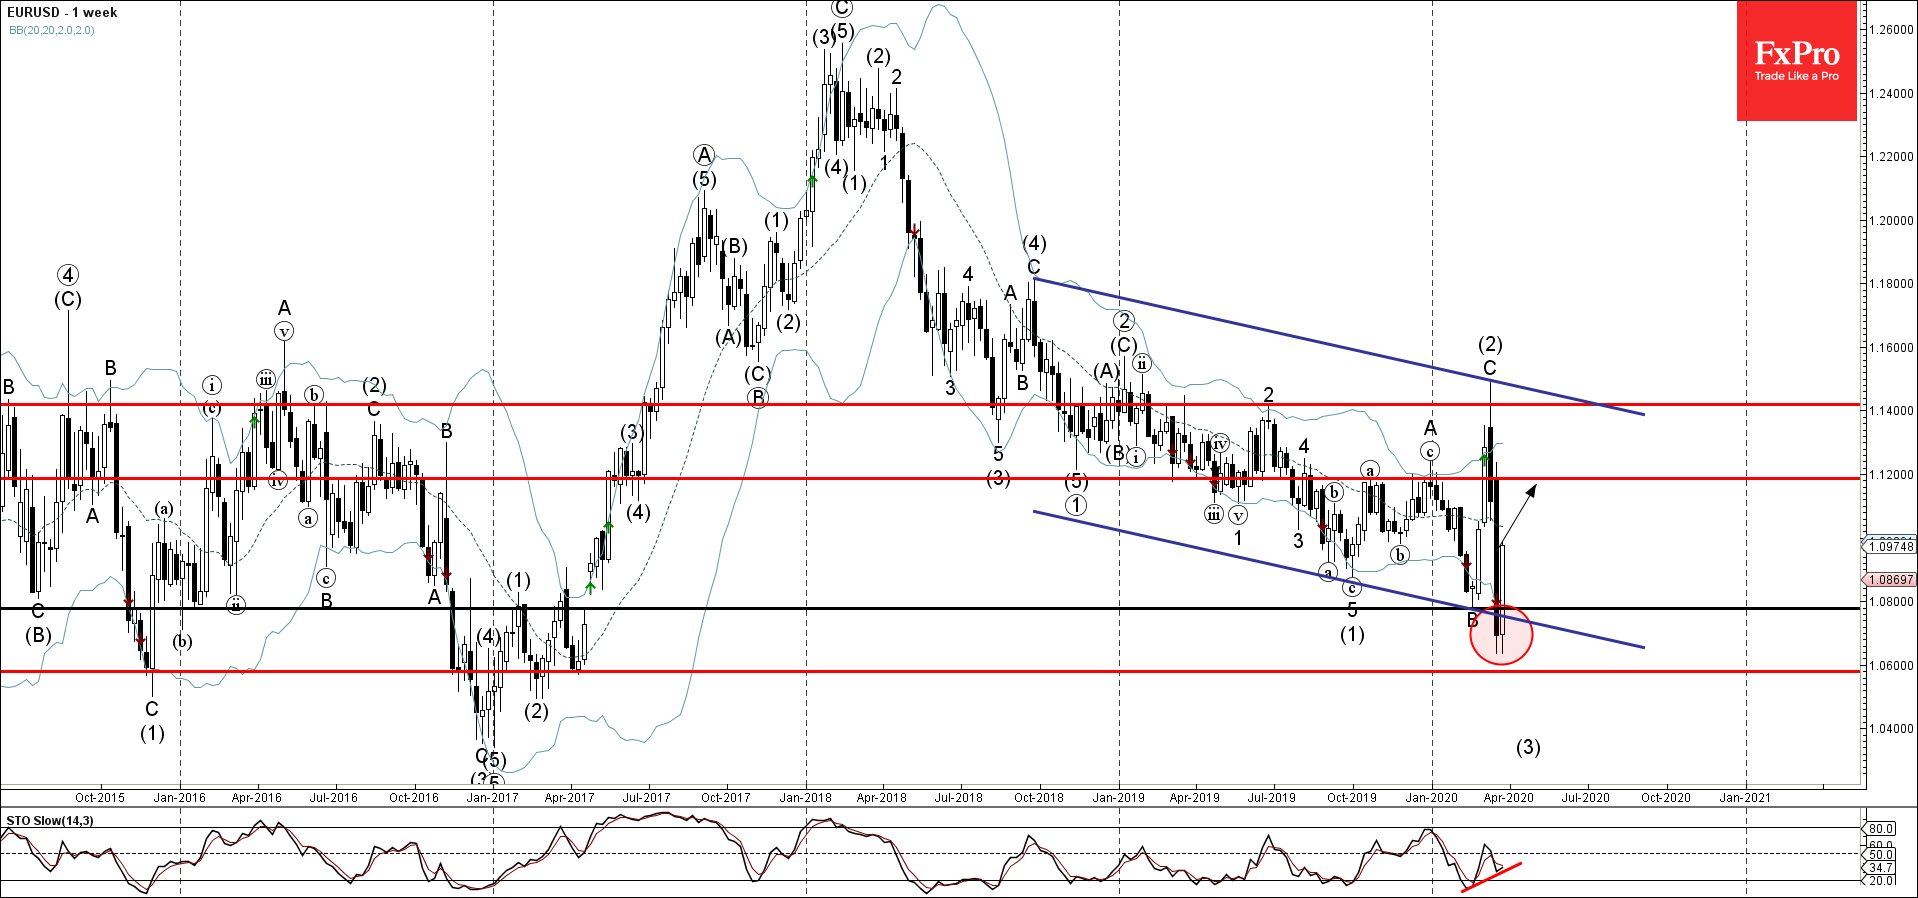
EURUSD recently reversed up from the combined support zone lying between the key support level 1.0600 (which started the sharp uptrend in 2017), lower weekly Bollinger Band and the support trendline of the weekly down channel from 2018.

The upward reversal from this support zone stopped the previous weekly downward impulse sequence (3).

With the clear bullish divergence visible on the weekly Stochastic indicator – EURUSD is likely to rise further toward the next resistance level 1.1200.

The FxPro Tech Analysis Team

The FxPro technical experts prepare a daily analysis of the most active currency pairs (majors, crosses, exotics) and commodities. Selected instruments are reviewed on daily trends (D1, H4), using the active Elliott Wave setups, Japanese candlesticks, indicators, and support/resistance levels.

Share
Published by
The FxPro Tech Analysis Team
Tags: EURUSD

Recent Posts

US Indices: growth widens, but are expectations too high?

Tech sell-off and high Q4 forecasts put the S&P 500 at risk; the Russell 2000…

2 hours ago

Markets pick up signals from the White House

Donald Trump has no intention of dismissing Jerome Powell. The White House's decision to postpone…

5 hours ago

Nat Gas Current situation #tradelikeapro #tradingshort #tradingtips #gas #tradingstrategy #trading

Today is Thursday, January 15th. Once again we will talk about the gas market. The…

5 hours ago

Bitcoin aims to break out of a corrective rebound

Crypto market rebounds, Bitcoin eyes $100K, Dash surges, institutional demand rises, and Ethereum staking hits…

5 hours ago

Bitcoin Wave Analysis – 14 January 2026

Bitcoin: ⬆️ Buy - Bitcoin broke resistance area - Likely to rise to resistance level…

20 hours ago

NZDJPY Wave Analysis – 14 January 2026

NZDJPY: ⬇️ Sell - NZDJPY reversed down from the resistance area - Likely to fall…

20 hours ago

This website uses cookies