Categories: Technical analysis

EURUSD Wave Analysis – 25 October, 2021

• EURUSD reversed from resistance zone

• Likely to fall to support level 1.1570                                                                        


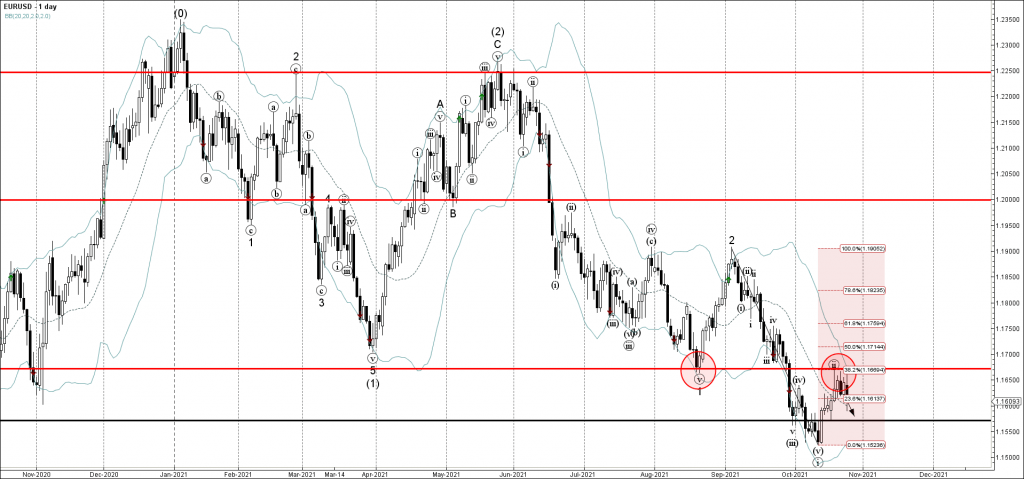
EURUSD currency pair recently reversed down from the resistance zone lying between the pivotal resistance level 1.1675 (former monthly low from August), upper daily Bollinger Band and the 38.2% Fibonacci correction of the downward impulse from the start of September.

The downward reversal from this resistance zone stopped the earlier short-term corrective wave (ii).

Given the multi-month downtrend on the daily charts, EURUSD can be expected to fall further toward the next support level 1.1570.

The FxPro Tech Analysis Team

The FxPro technical experts prepare a daily analysis of the most active currency pairs (majors, crosses, exotics) and commodities. Selected instruments are reviewed on daily trends (D1, H4), using the active Elliott Wave setups, Japanese candlesticks, indicators, and support/resistance levels.

Share
Published by
The FxPro Tech Analysis Team
Tags: EURUSD

Recent Posts

Crypto Market Retreats Due to Overhang of Sellers

Market picture The crypto market has lost 3.3% in the last 24 hours to $2.3…

47 mins ago

USDJPY Wave Analysis 26 April 2024

- USDJPY broke key resistance level 155.00 - Likely to rise to resistance level 160.00…

3 days ago

Ebay Wave Analysis 26 April 2024

- Ebay reversed from support level 49.35 - Likely to rise to resistance level 52.55…

3 days ago

False Alert with Yen Interventions?

Even though the Bank of Japan left the key rate and parameters of the QE…

3 days ago

Cooler Bitcoin

Market picture  Market Dynamics: The cryptocurrency market stabilised, losing just 0.1% of capitalisation and dropping to…

3 days ago

GBPCAD Wave Analysis 25 April 2024

- GBPCAD reversed from key support level 1.6910 - Likely to rise to resistance level…

4 days ago

This website uses cookies