Categories: Technical analysis

EURUSD Wave Analysis 23 July 2024

– EURUSD reversed from resistance area

– Likely to fall to support level 1.0800

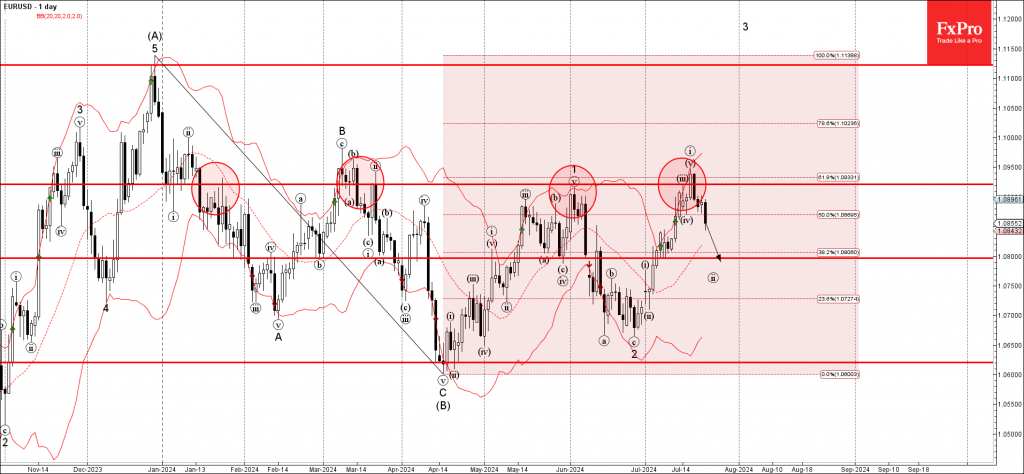
EURUSD currency pair recently reversed down from the resistance area set between the multi-month resistance level 1.0920 (which has been reversing the price from the start of this year), upper daily Bollinger Band and the 61.8% Fibonacci correction of the downward wave B from December.

The downward reversal from this resistance area created the daily Japanese candlesticks reversal pattern Bearish Engulfing – which started the active wave ii.

EURUSD currency pair can be expected to fall further to the next support level 1.0800 (target price for the completion of the active wave ii.

AddThis Website Tools
The FxPro Tech Analysis Team

The FxPro technical experts prepare a daily analysis of the most active currency pairs (majors, crosses, exotics) and commodities. Selected instruments are reviewed on daily trends (D1, H4), using the active Elliott Wave setups, Japanese candlesticks, indicators, and support/resistance levels.

Share
Published by
The FxPro Tech Analysis Team
Tags: EURUSD

Recent Posts

Video: Dollar and Indices are trying to find footing after the fall

The dollar experienced a sell-off but rallied back up by the end of the week.…

2 hours ago

What is next: BoJ, Fed, SNB & BoE Rates

The new week will be packed with economic data and decisions from key central banks.…

5 hours ago

Dollar attempts to rebound after oversold conditions

Despite economic factors working against the dollar, its oversold condition helped it this week or…

6 hours ago

USDCAD Wave Analysis – 14 March 2025

USDCAD: ⬇️ Sell - USDCAD reversed from key resistance level 1.4500 - Likely to fall…

7 hours ago

Solana Wave Analysis – 14 March 2025

Solana: ⬆️ Buy - Solana reversed from the long-term support level 113.75 - Likely to…

7 hours ago

Adobe Wave Analysis – 13 March 2025

Adobe: ⬇️ Sell - Adobe broke round support level 400.00 - Likely to fall to…

22 hours ago