Categories: Technical analysis

EURUSD Wave Analysis 20 August 2024

– EURUSD broke resistance area

– Likely to rise to resistance level 1.1135

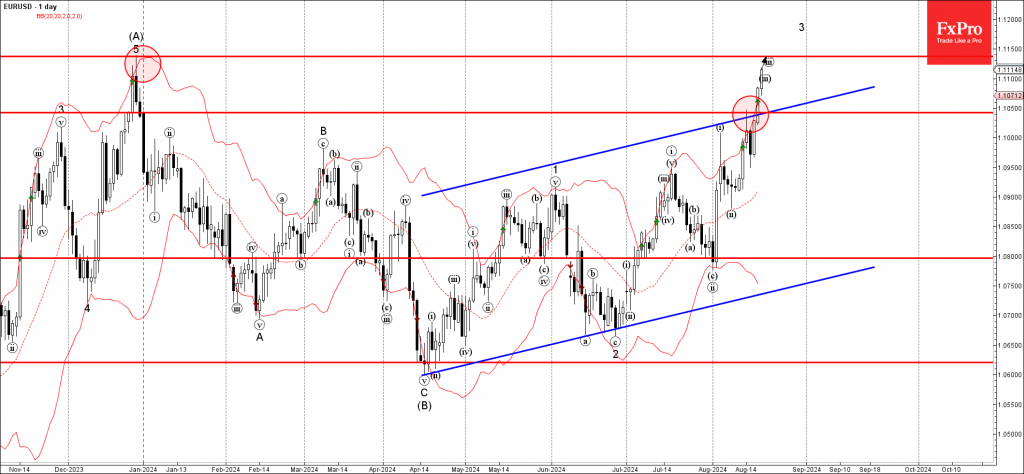
EURUSD currency pair just broke the resistance area located between the resistance level 1.105 (which reversed the price last week) and the resistance trendline of the daily up channel from the middle of April.

The breakout of this resistance area accelerated the active impulse waves iii and 3 – both of which belong to the impulse wave C from April.

Given the strongly bearish US dollar sentiment seen across the FX markets today, EURUSD currency pair can be expected to rise further toward the next resistance level 1.1135 (multi-month high from December) – from where the downward correction is likely.

The FxPro Tech Analysis Team

The FxPro technical experts prepare a daily analysis of the most active currency pairs (majors, crosses, exotics) and commodities. Selected instruments are reviewed on daily trends (D1, H4), using the active Elliott Wave setups, Japanese candlesticks, indicators, and support/resistance levels.

Share
Published by
The FxPro Tech Analysis Team
Tags: EURUSD

Recent Posts

CHFJPY Wave Analysis – 9 January 2026

CHFJPY: ⬆️ Buy - CHFJPY reversed from support area - Likely to rise to resistance…

2 days ago

Exxon Mobil Wave Analysis – 9 January 2026

Exxon Mobil: ⬆️ Buy - Exxon Mobil reversed from support area - Likely to rise…

2 days ago

Pro News Weekly: Dollar Rebounds as Markets Test New Limits

Welcome to Pro News Weekly! Here’s what is shaping the markets: 💵 The U.S. dollar…

2 days ago

Geopolitics will destroy the euro

•    EURUSD falls due to geopolitics and expectations of tariff removal •    Gold returns to…

3 days ago

Platinum Wave Analysis – 8 January 2026

Platinum: ⬇️ Sell - Platinum reversed from pivotal resistance level 150.00 - Likely to fall to…

3 days ago

Baidu Wave Analysis – 8 January 2026

Baidu: ⬇️ Sell - Baidu reversed from resistance zone - Likely to fall to support level…

3 days ago

This website uses cookies