Categories: Technical analysis

EURUSD Wave Analysis – 2 August, 2022

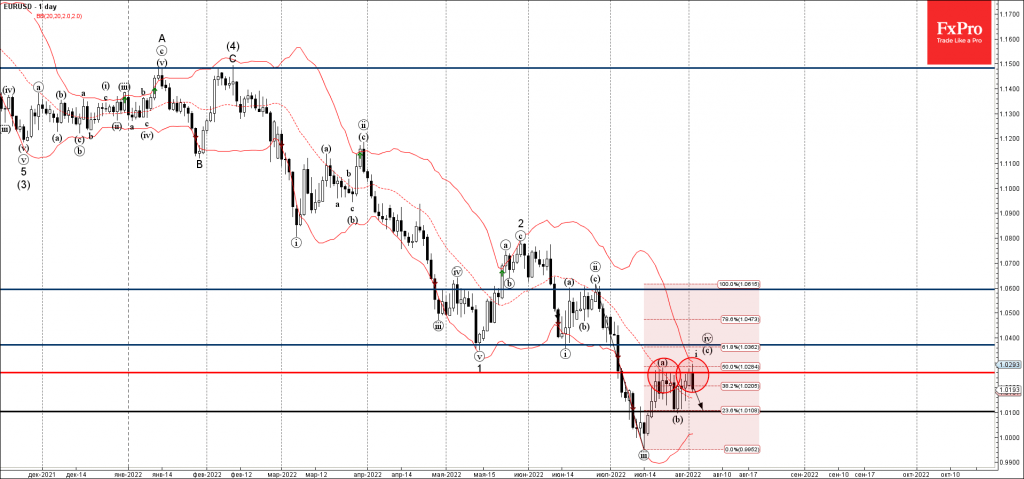
• EURUSD reversed from resistance level 1.0260

• Likely to fall to support level 1.0100

EURUSD currency pair recently reversed down from the resistance level 1.0260 (which has been repeatedly reversing this currency pair from the middle of July).

The resistance zone near the resistance level 1.0260 was strengthened by the upper daily Bollinger Band and by the 50% Fibonacci correction of the downward impulse from June.

Given the strong daily downtrend, EURUSD currency pair can be expected to fall further in the next support level 1.0100 (low of wave (b) from last month).

AddThis Website Tools
The FxPro Tech Analysis Team

The FxPro technical experts prepare a daily analysis of the most active currency pairs (majors, crosses, exotics) and commodities. Selected instruments are reviewed on daily trends (D1, H4), using the active Elliott Wave setups, Japanese candlesticks, indicators, and support/resistance levels.

Share
Published by
The FxPro Tech Analysis Team
Tags: EURUSD

Recent Posts

The Rapid Assault on Crypto

The cryptocurrency market experienced a significant surge, with market capitalisation reaching $2.95 trillion. Bitcoin is…

5 minutes ago

Bitcoin Wave Analysis – 22 April 2025

Bitcoin: ⬆️ Buy - Bitcoin broke round resistance level 90000.00 - Likely to rise to…

14 hours ago

AUDUSD Wave Analysis – 22 April 2025

AUDUSD: ⬇️ Sell - AUDUSD reversed from the key resistance level 0.6400 - Likely to…

14 hours ago

Crypto Market Escapes from Fear

Market Overview The crypto market has gained around 2% over the past seven days, with…

1 day ago

Nike Wave Analysis – 21 April 2025

Nike: ⬆️ Buy - Nike reversed from the long-term support level 52.60 - Likely to…

2 days ago

Natural Gas Wave Analysis – 21 April 2025

Natural gas: ⬇️ Sell Natural gas broke support area Likely to fall to support level…

2 days ago