Categories: Technical analysis

EURUSD Wave Analysis – 19 November , 2018

  • EURUSD reversed from support area
  • Further gains are likely

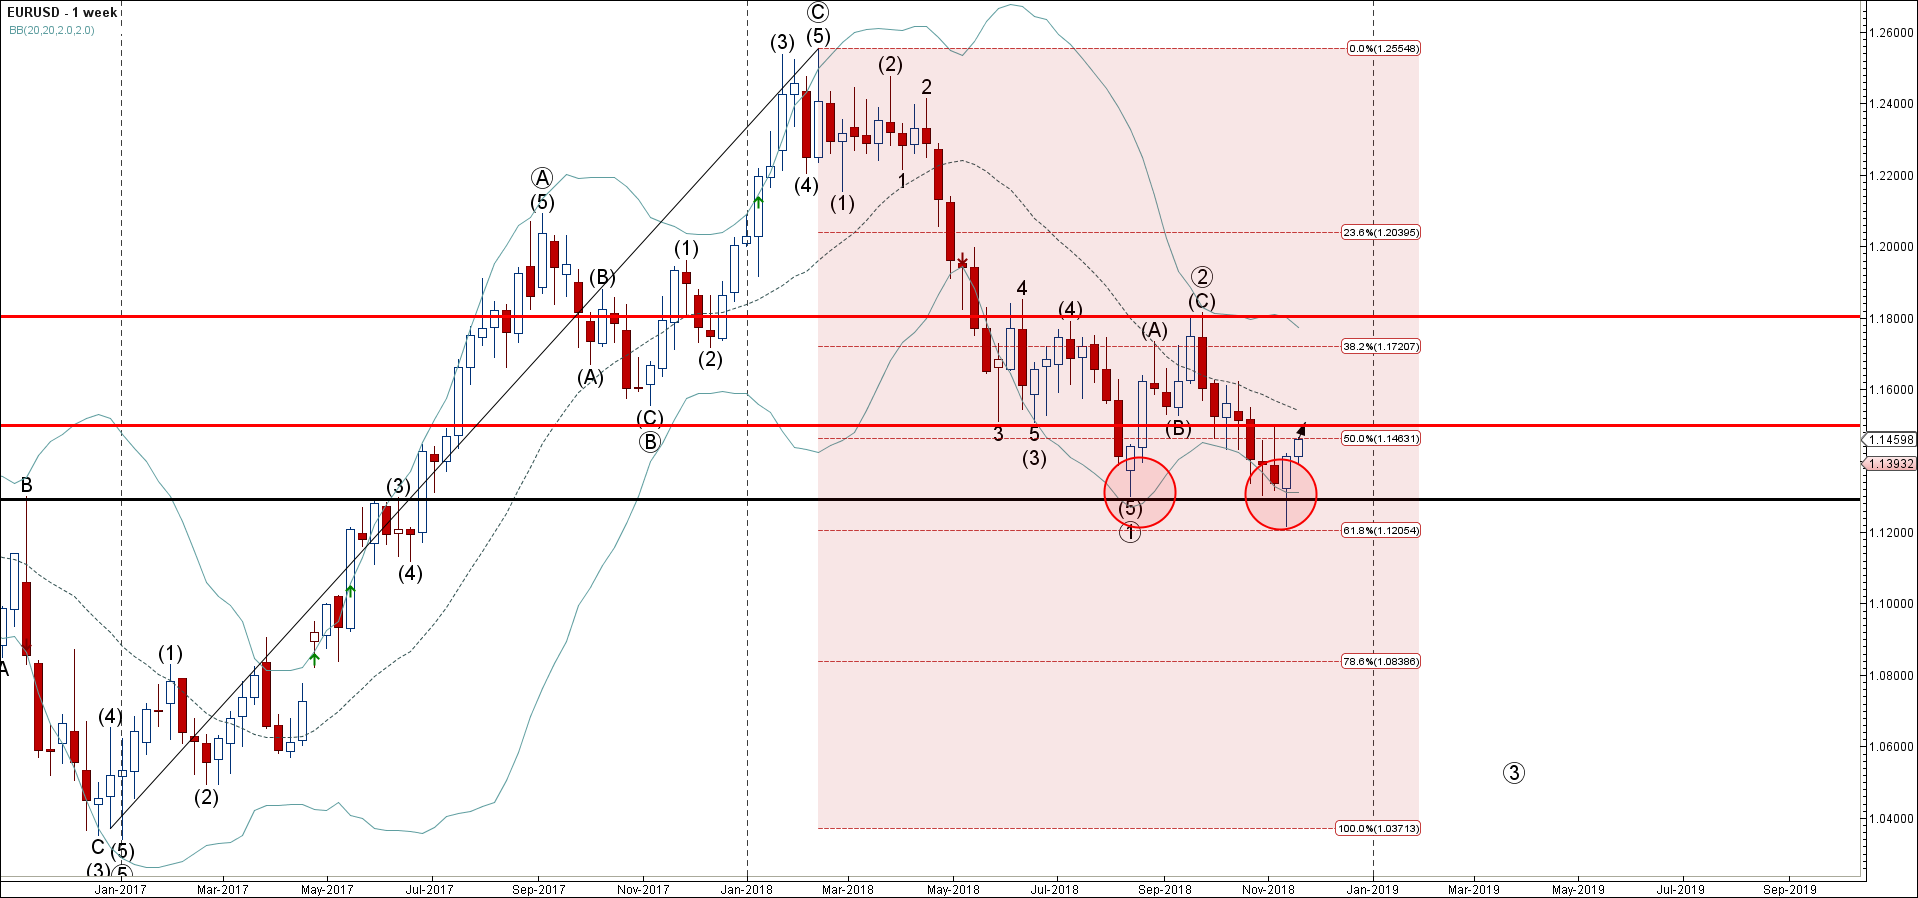
EURUSD has been rising in the last few trading sessions following the earlier upward reversal from the support area lying between the strong support level 1.1290 (monthly low from August), lower daily Bollinger Band and the 61.8% Fibonacci correction of the previous upward impulse from the end of 2016.

The upward reversal from this support area created the weekly Japanese candlesticks reversal pattern Bullish Engulfing.

EURUSD is expected to rise further and re-test the next key resistance level 1.1500 (which reversed the price earlier this month). Strong support remains at 1.1290.

EURUSD

AddThis Website Tools
The FxPro Tech Analysis Team

The FxPro technical experts prepare a daily analysis of the most active currency pairs (majors, crosses, exotics) and commodities. Selected instruments are reviewed on daily trends (D1, H4), using the active Elliott Wave setups, Japanese candlesticks, indicators, and support/resistance levels.

Share
Published by
The FxPro Tech Analysis Team
Tags: EURUSD

Recent Posts

Apple Wave Analysis – 20 March 2025

Apple: ⬇️ Sell - Apple reversed from resistance level 220.00 - Likely to fall to…

3 hours ago

IBM Wave Analysis – 20 March 2025

IBM: ⬆️ Buy - IBM reversed from support zone - Likely to rise to resistance…

3 hours ago

AUDNZD Wave Analysis – 20 March 2025

AUDNZD: ⬆️ Buy - AUDNZD reversed from key support level 1.0930 - Likely to rise…

5 hours ago

EURCAD Wave Analysis – 20 March 2025

EURCAD: ⬇️ Sell - EURCAD reversed from the resistance zone - Likely to fall to…

5 hours ago

Crypto Market Testing Resistance

The crypto market has increased by over 5% and is nearing the $2.9 trillion. The…

10 hours ago

Gold Wave Analysis – 19 March 2025

Gold: ⬆️ Buy - Gold continues daily uptrend - Likely to rise to resistance level…

1 day ago