Categories: Technical analysis

EURUSD Wave Analysis 18 November 2024

– EURUSD reversed from long-term support level 1.0500

– Likely to rise to resistance level 1.0620

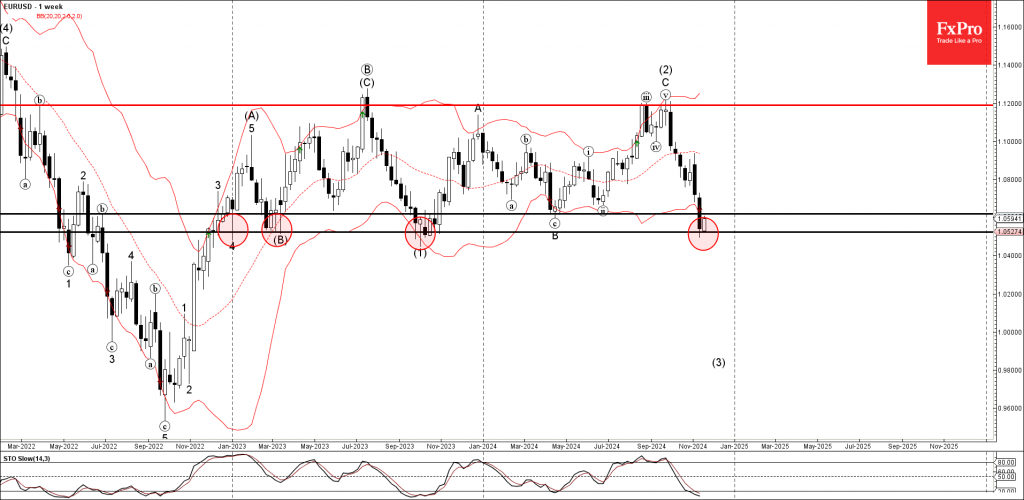
EURUSD currency pair recently reversed up from the major long-term support level 1.0500 (which has been steadily reversing the price from the start of 2023, as can be seen below), standing close to the lower daily Bollinger Band.

The support level 1.0500 level was further strengthened by the lower daily Bollinger Band.

Given the strength of the support level 1.0500, oversold weekly Stochastic and the strong US dollar bearishness seen today, EURUSD currency pair can be expected to rise to the next resistance level 1.06200, former support from the start of this year.

The FxPro Tech Analysis Team

The FxPro technical experts prepare a daily analysis of the most active currency pairs (majors, crosses, exotics) and commodities. Selected instruments are reviewed on daily trends (D1, H4), using the active Elliott Wave setups, Japanese candlesticks, indicators, and support/resistance levels.

Share
Published by
The FxPro Tech Analysis Team
Tags: EURUSD

Recent Posts

Video: Dollar and Indices are trying to find footing after the fall

The dollar experienced a sell-off but rallied back up by the end of the week.…

3 days ago

What is next: BoJ, Fed, SNB & BoE Rates

The new week will be packed with economic data and decisions from key central banks.…

3 days ago

Dollar attempts to rebound after oversold conditions

Despite economic factors working against the dollar, its oversold condition helped it this week or…

3 days ago

USDCAD Wave Analysis – 14 March 2025

USDCAD: ⬇️ Sell - USDCAD reversed from key resistance level 1.4500 - Likely to fall…

3 days ago

Solana Wave Analysis – 14 March 2025

Solana: ⬆️ Buy - Solana reversed from the long-term support level 113.75 - Likely to…

3 days ago

Adobe Wave Analysis – 13 March 2025

Adobe: ⬇️ Sell - Adobe broke round support level 400.00 - Likely to fall to…

3 days ago

This website uses cookies