Categories: Technical analysis

EURUSD Wave Analysis – 18 December, 2019

  • EURUSD reversed from resistance area
  • Likely to fall to 1.1100

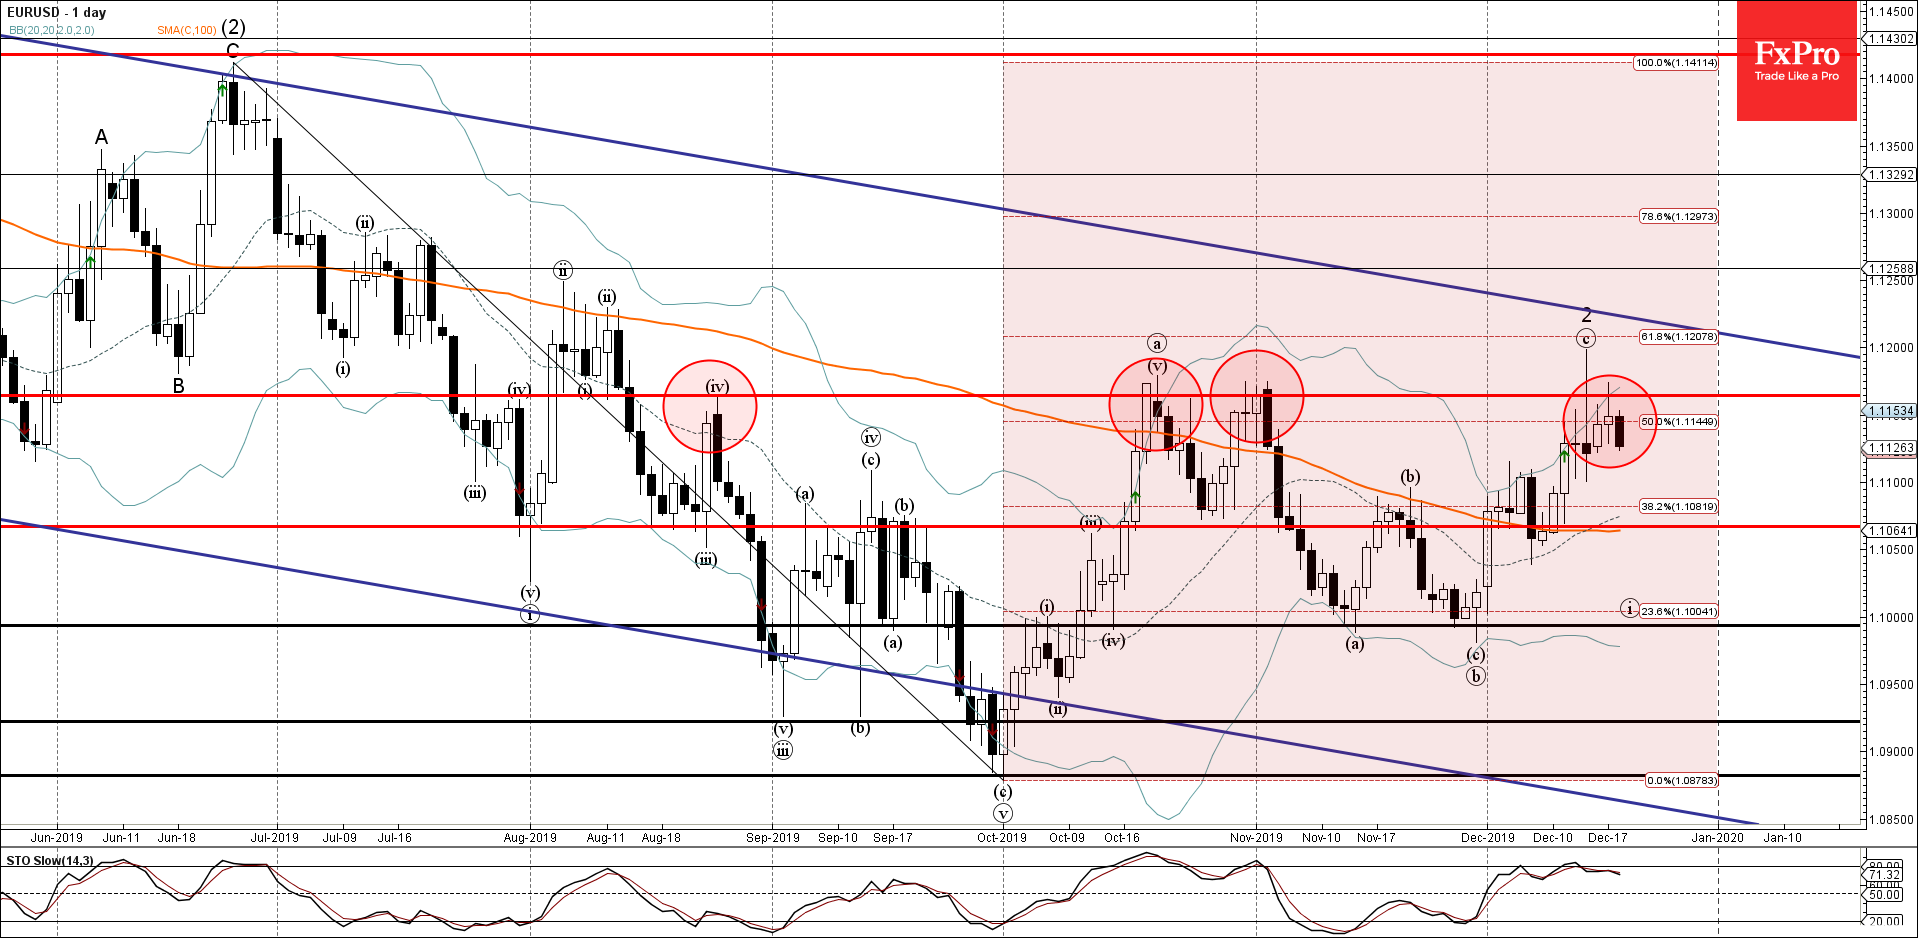
EURUSD recently reversed down from the resistance area lying between the key resistance level 1.1165 (which has been steadily reversing the price from August), upper daily Bollinger Band and the 61.8% Fibonacci correction of the previous downward impulse from June.

The downward reversal from this resistance area created the daily Japanese candlesticks reversal pattern Shooting Star – which started the active impulse wave 3.

EURUSD is expected to fall further toward the next support level 1.1100 (former resistance from November).

The FxPro Tech Analysis Team

The FxPro technical experts prepare a daily analysis of the most active currency pairs (majors, crosses, exotics) and commodities. Selected instruments are reviewed on daily trends (D1, H4), using the active Elliott Wave setups, Japanese candlesticks, indicators, and support/resistance levels.

Share
Published by
The FxPro Tech Analysis Team
Tags: EURUSD

Recent Posts

Central banks did not scare the dollar

•    Central banks prefer to pause. •   The strengthening of the dollar prevented gold from…

47 minutes ago

The crypto market is updating its lows but avoiding sharp changes

Market Picture The crypto market set another trap for bulls yesterday afternoon, jumping to $3T…

2 hours ago

JPMorgan Chase Wave Analysis – 18 December 2025

JPMorgan Chase: ⬇️ Sell - JPMorgan Chase reversed from resistance area - Likely to fall…

12 hours ago

EURUSD Wave Analysis – 18 December 2025

EURUSD: ⬇️ Sell - EURUSD reversed from resistance area - Likely to fall to support level…

12 hours ago

AUDJPY Wave Analysis – 18 December 2025

AUDJPY: ⬆️ Buy - AUDJPY reversed from support area - Likely to rise to resistance…

13 hours ago

Palladium Wave Analysis – 18 December 2025

Palladium: ⬆️ Buy - Palladium broke multi-month resistance level 1600.00 - Likely to rise to resistance…

13 hours ago

This website uses cookies