Categories: Technical analysis

EURUSD Wave Analysis 16 February 2024

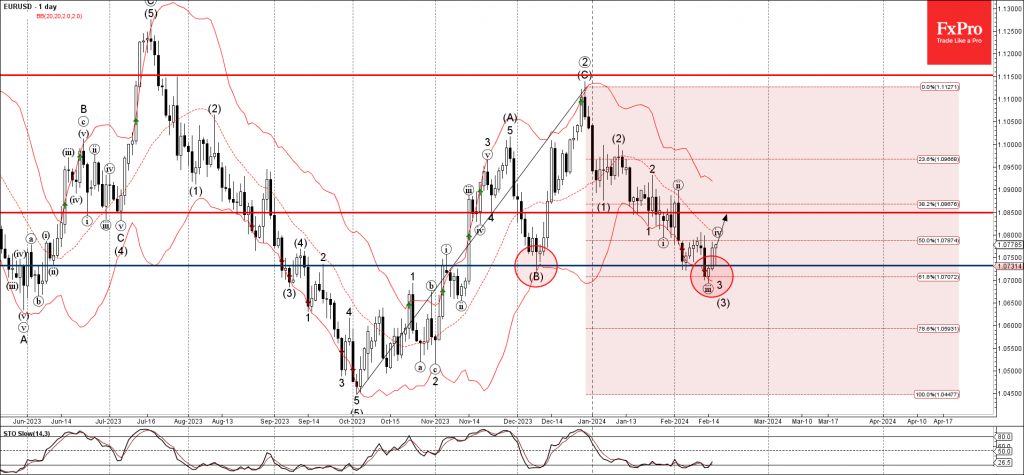
– EURUSD reversed from support level 1.0730

– Likely to rise to resistance level 1.0850

EURUSD currency pair recently reversed up from the support level 1.0730 (previous monthly low from December), intersecting with the lower daily Bollinger Band and the 61.8% Fibonacci correction of the upward impulse from October.

The upward reversal from the support level 1.0730 created the strong daily Japanese candlestick reversal pattern Morning Star.

Given the continuation of the USD outflows, EURUSD currency pair can be expected to rise further to the next resistance level 1.0850.

The FxPro Tech Analysis Team

The FxPro technical experts prepare a daily analysis of the most active currency pairs (majors, crosses, exotics) and commodities. Selected instruments are reviewed on daily trends (D1, H4), using the active Elliott Wave setups, Japanese candlesticks, indicators, and support/resistance levels.

Share
Published by
The FxPro Tech Analysis Team
Tags: EURUSD

Recent Posts

Nikkei 225 index Wave Analysis 20 September 2024

- Nikkei 225 index rising inside minor impulse waves 3 - Likely to reach resistance…

3 hours ago

NZDJPY Wave Analysis 20 September 2024

- NZDJPY rising inside corrective wave ii - Likely to rise to resistance level 91.65…

3 hours ago

Gold terminates the last sceptics

Gold started the week with new highs and ended the week up 1.3%, despite a…

9 hours ago

The Crypto Market’s Steady Ascent

Crypto market cap rose by 3.2% to $2.21 trillion overnight. This made the struggle to…

15 hours ago

Gold Wave Analysis 19 September 2024

- Gold reversed from support level 2550.00 - Likely to rise to resistance level 2600.00…

1 day ago

S&P 500 Wave Analysis 19 September 2024

- S&P 500 broke key resistance level 5670.00 - Likely to rise to resistance level…

1 day ago

This website uses cookies