Categories: Technical analysis

EURUSD Wave Analysis 14 January, 2021

• EURUSD reversed from resistance zone

• Likely to fall to 1,2060

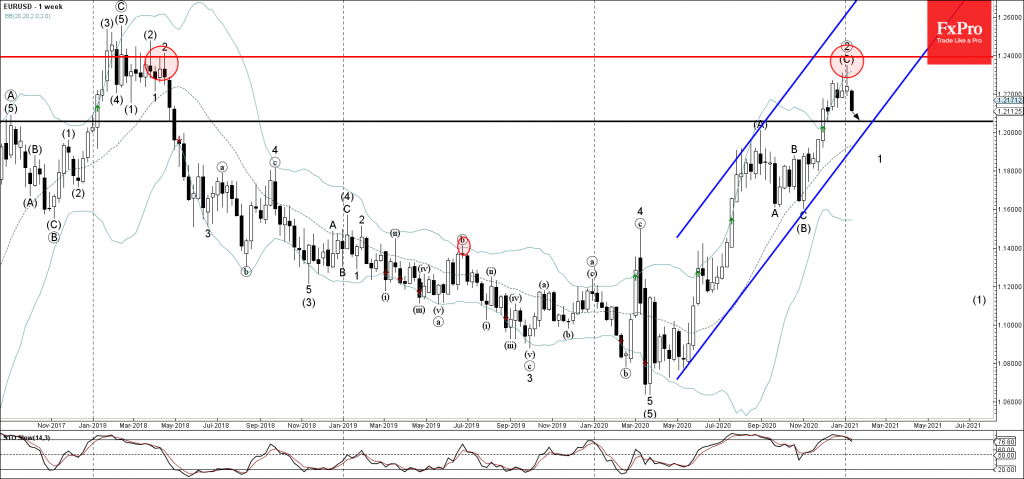
EURUSD continues to fall after the pair reversed down from the resistance zone lying between the major  resistance level 1,2400 (which reversed the price multiple times at the start of 2018) and the upper weekly Bollinger Band.

The downward reversal from this resistance zone created the weekly Japanese candlesticks reversal pattern Shooting Star.

EURUSD is expected to fall further toward the next support level 1,2060 (former top of wave (A) from the middle of 2020).

The FxPro Tech Analysis Team

The FxPro technical experts prepare a daily analysis of the most active currency pairs (majors, crosses, exotics) and commodities. Selected instruments are reviewed on daily trends (D1, H4), using the active Elliott Wave setups, Japanese candlesticks, indicators, and support/resistance levels.

Share
Published by
The FxPro Tech Analysis Team
Tags: EURUSD

Recent Posts

Gold Wave Analysis – 12 December 2025

Gold: ⬇️ Sell - Gold reversed from strong resistance level 4350.00 - Likely to fall to…

2 days ago

EURGBP Wave Analysis – 12 December 2025

EURGBP: ⬆️ Buy - EURGBP reversed from support zone - Likely to rise to resistance level…

2 days ago

Filecoin Wave Analysis – 12 December 2025

Filecoin: ⬇️ Sell - Filecoin broke key support level 1.435 - Likely to fall to support…

2 days ago

Ethereum Wave Analysis – 12 December 2025

Ethereum: ⬇️ Sell - Ethereum reversed from resistance level 3400.00 - Likely to fall to support…

2 days ago

Pro News Weekly: Global Markets at a Turning Point

Welcome to Pro News Weekly! Here’s what is moving the markets: 💵 The Fed fails…

3 days ago

Crypto: slight rebound within a bear market

Crypto rebounds slightly in a bear market; resistance holds, optimism rises, but the outlook remains…

3 days ago

This website uses cookies