Categories: Technical analysis

EURUSD Wave Analysis – 12 April 2023

• EURUSD under bullish pressure

• Likely to rise to resistance level 1.1035

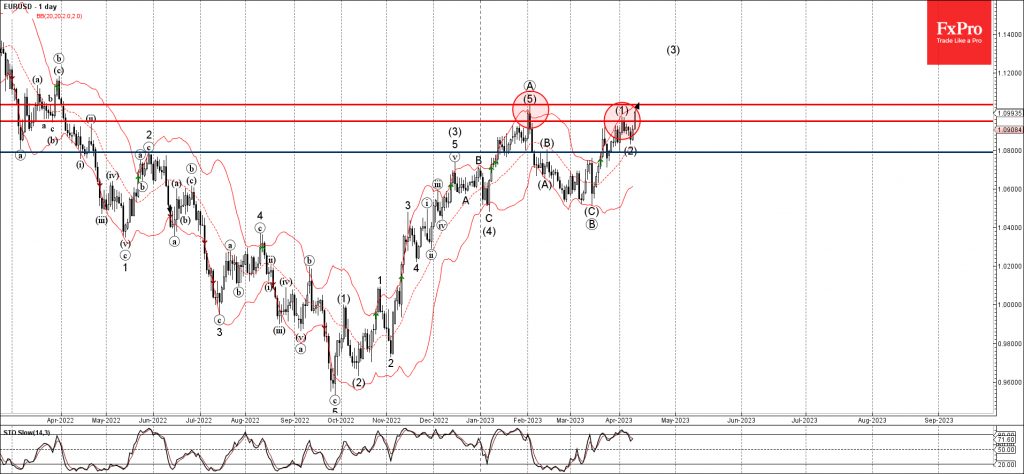
EURUSD currency pair under the bullish pressure after the earlier breakout of the resistance level 1.0950 (former top of the previous impulse wave (1) from the end of March).

The breakout of the resistance level continues the active medium-term impulse wave (3) from the start of April.

Given the strong daily uptrend, EURUSD can then be expected to rise further toward the next resistance level 1.1035 (former multi-month high from February).

AddThis Website Tools
The FxPro Tech Analysis Team

The FxPro technical experts prepare a daily analysis of the most active currency pairs (majors, crosses, exotics) and commodities. Selected instruments are reviewed on daily trends (D1, H4), using the active Elliott Wave setups, Japanese candlesticks, indicators, and support/resistance levels.

Share
Published by
The FxPro Tech Analysis Team
Tags: EURUSD

Recent Posts

The Rapid Assault on Crypto

The cryptocurrency market experienced a significant surge, with market capitalisation reaching $2.95 trillion. Bitcoin is…

2 hours ago

Bitcoin Wave Analysis – 22 April 2025

Bitcoin: ⬆️ Buy - Bitcoin broke round resistance level 90000.00 - Likely to rise to…

17 hours ago

AUDUSD Wave Analysis – 22 April 2025

AUDUSD: ⬇️ Sell - AUDUSD reversed from the key resistance level 0.6400 - Likely to…

17 hours ago

Crypto Market Escapes from Fear

Market Overview The crypto market has gained around 2% over the past seven days, with…

1 day ago

Nike Wave Analysis – 21 April 2025

Nike: ⬆️ Buy - Nike reversed from the long-term support level 52.60 - Likely to…

2 days ago

Natural Gas Wave Analysis – 21 April 2025

Natural gas: ⬇️ Sell Natural gas broke support area Likely to fall to support level…

2 days ago