Categories: Technical analysis

EURUSD Wave Analysis 11 December 2024

– EURUSD reversed from resistance zone

– Likely to fall to support level 1.0450

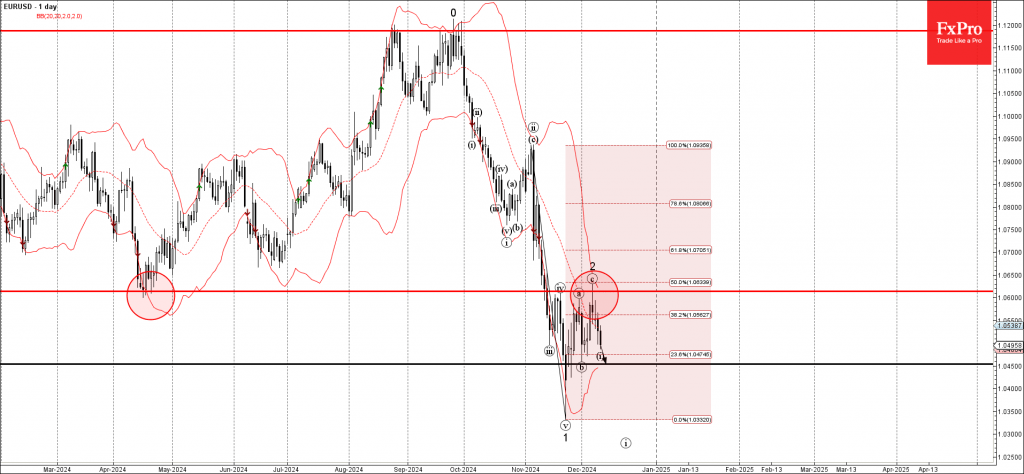
EURUSD currency pair recently reversed down with the long-legged Doji from the resistance area between the upper daily Bollinger Band, pivotal resistance level 1.0610 (former multi-month support from April) and the 50% Fibonacci correction of the downward impulse from the start of November.

The downward reversal from this resistance zone started the active minor downward impulse wave 3.

Given the strength of the aforementioned resistance area and the clear daily downtrend, EURUSD currency pair can be expected to fall further to the next support level 1.0450 (low of the earlier minor correction b).

The FxPro Tech Analysis Team

The FxPro technical experts prepare a daily analysis of the most active currency pairs (majors, crosses, exotics) and commodities. Selected instruments are reviewed on daily trends (D1, H4), using the active Elliott Wave setups, Japanese candlesticks, indicators, and support/resistance levels.

Share
Published by
The FxPro Tech Analysis Team
Tags: EURUSD

Recent Posts

Geopolitics will destroy the euro

•    EURUSD falls due to geopolitics and expectations of tariff removal •    Gold returns to…

7 hours ago

Platinum Wave Analysis – 8 January 2026

Platinum: ⬇️ Sell - Platinum reversed from pivotal resistance level 150.00 - Likely to fall to…

20 hours ago

Baidu Wave Analysis – 8 January 2026

Baidu: ⬇️ Sell - Baidu reversed from resistance zone - Likely to fall to support level…

20 hours ago

EURUSD Wave Analysis – 8 January 2026

EURUSD: ⬇️ Sell - EURUSD broke daily up channel - Likely to fall to support…

21 hours ago

WTI crude oil Wave Analysis – 8 January 2026

WTI crude oil: ⬆️ Buy - WTI crude oil reversed from support zone - Likely…

22 hours ago

Do not underestimate dollar

Positive macro statistics for the US are helping the greenback. Gold could rise to $4,610…

1 day ago

This website uses cookies