Categories: Technical analysis

EURSUD Wave Analysis 21 October 2024

– EURSUD reversed from resistance level 1.0875

– Likely to fall to support level 1.0800

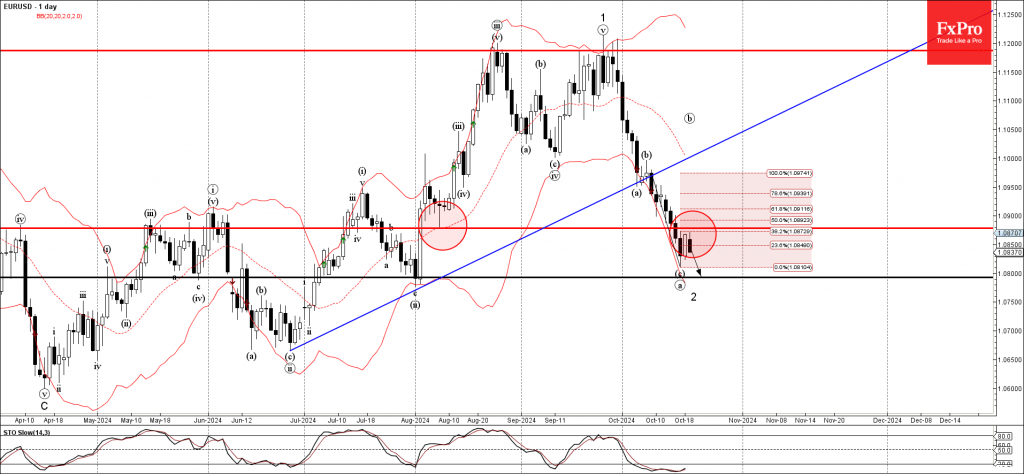
EURSUD currency pair recently reversed down from the key resistance level 1.0875 (former support from the start of August) standing near the 38.2% Fibonacci correction of the downward impulse from the start of this month.

The downward reversal from the resistance level 1.0875 continues the active short-term ABC correction 2 from the end of September.

Given the strongly bullish US dollar sentiment seen across the FX markets today, EURSUD currency pair can be expected to fall further to the next support level 1.0800, former strong support from July.

The FxPro Tech Analysis Team

The FxPro technical experts prepare a daily analysis of the most active currency pairs (majors, crosses, exotics) and commodities. Selected instruments are reviewed on daily trends (D1, H4), using the active Elliott Wave setups, Japanese candlesticks, indicators, and support/resistance levels.

Share
Published by
The FxPro Tech Analysis Team
Tags: EURSUD

Recent Posts

NZDCAD Wave Analysis – 7 January 2026

NZDCAD: ⬆️ Buy - NZDCAD reversed from support zone - Likely to rise to resistance…

12 hours ago

Bitcoin Wave Analysis – 7 January 2026

Bitcoin: ⬇️ Sell - Bitcoin reversed from resistance zone - Likely to fall to support…

12 hours ago

EURGBP Wave Analysis – 7 January 2026

EURGBP: ⬆️ Buy - EURGBP reversed from support zone - Likely to rise to resistance…

12 hours ago

Brent Crude Oil Wave Analysis – 7 January 2026

Brent Crude Oil: ⬇️ Sell - Brent Crude Oil reversed from resistance zone - Likely…

12 hours ago

Old fears about the euro have returned

The resurgence of the political crisis in France is weighing on EURUSD The US dollar…

21 hours ago

The crypto market has hit the upper limit of its rebound

The crypto market faces resistance at $3.2T; sentiment rises, but selling pressure persists. Bitcoin and…

1 day ago

This website uses cookies