Categories: Technical analysis

EURO50 Wave Analysis – 09 March, 2020

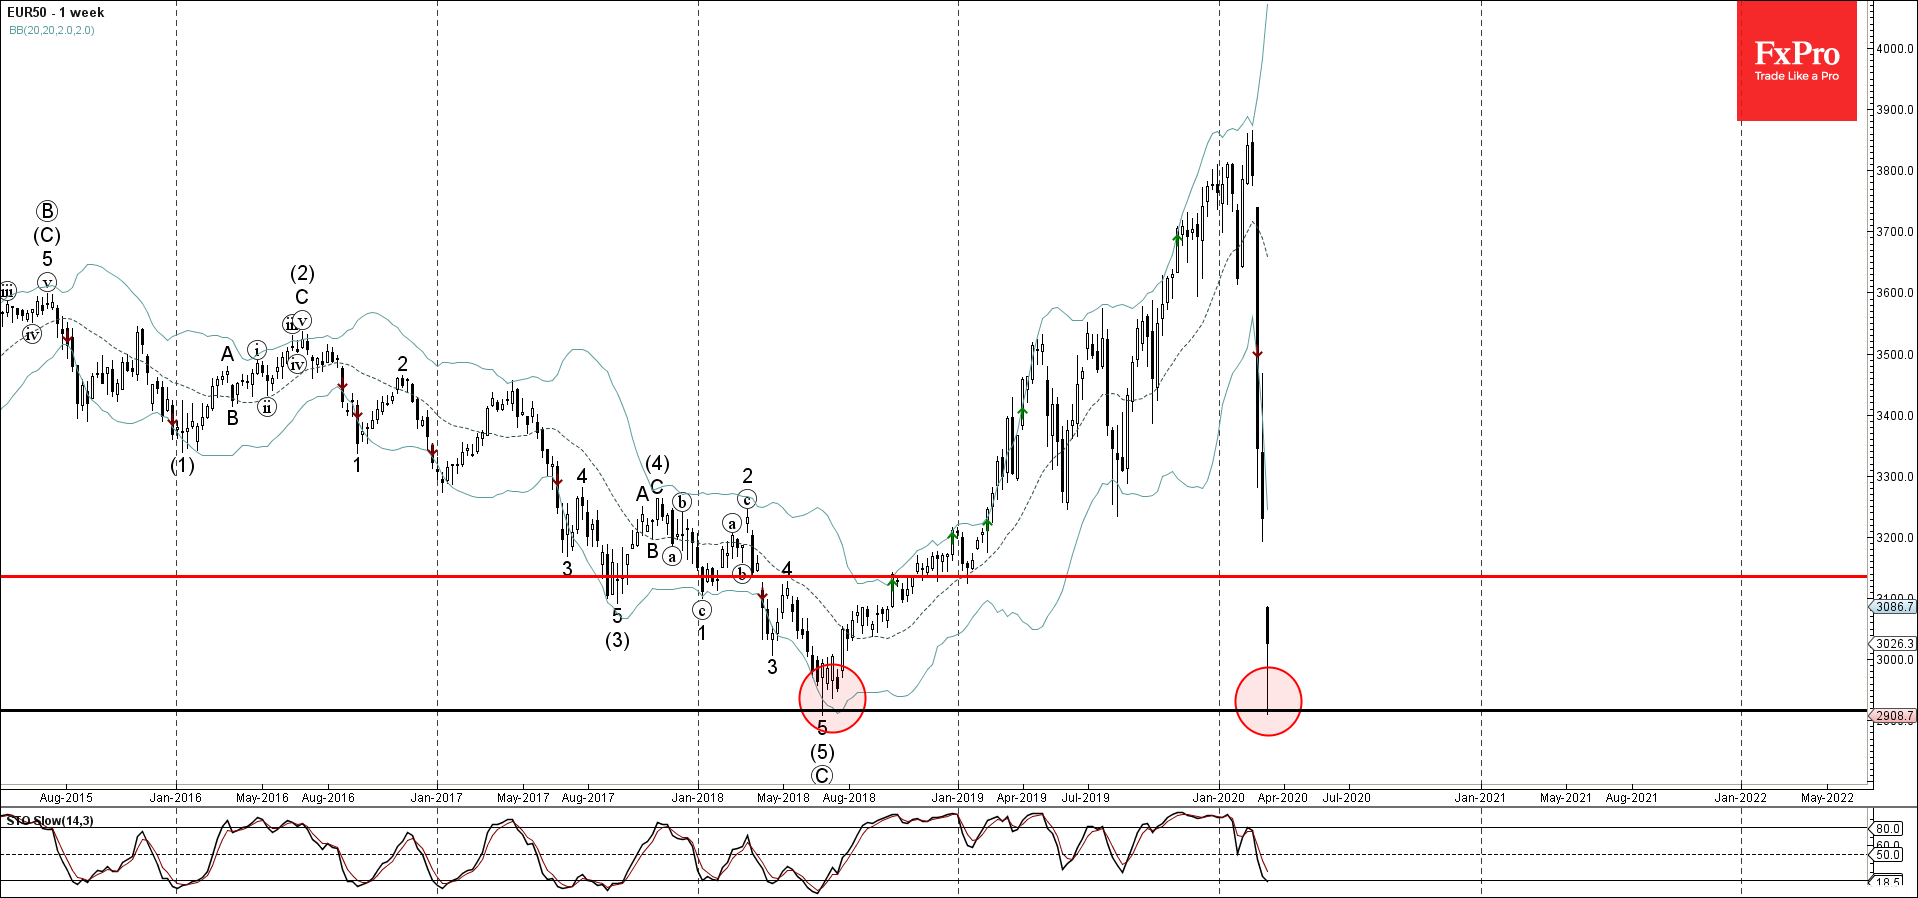
  • EURO50 reversed from support area
  • Likely to rise to 3135.00

EURO50 today reversed up from the support area lying between the long-term support level 2915.00 (which reversed the price in the middle of 2018) and the lower weekly Bollinger Band.

The upward reversal from this support area stopped the earlier sharp downward correction from February.

Given the oversold reading on the daily Stochastic indicator and the strength of the support level 2915.00 – EURO50 is likely to extend the upward correction to the next resistance level 3135.00 – after which the index might retest the support level 2915.00.

The FxPro Tech Analysis Team

The FxPro technical experts prepare a daily analysis of the most active currency pairs (majors, crosses, exotics) and commodities. Selected instruments are reviewed on daily trends (D1, H4), using the active Elliott Wave setups, Japanese candlesticks, indicators, and support/resistance levels.

Share
Published by
The FxPro Tech Analysis Team
Tags: euro50

Recent Posts

Bitcoin Wave Analysis – 14 January 2026

Bitcoin: ⬆️ Buy - Bitcoin broke resistance area - Likely to rise to resistance level…

14 hours ago

NZDJPY Wave Analysis – 14 January 2026

NZDJPY: ⬇️ Sell - NZDJPY reversed down from the resistance area - Likely to fall…

14 hours ago

What is Leverage?

Leverage is a mechanism that lets traders control larger positions using smaller capital. By choosing…

18 hours ago

The dollar does not tolerate dissent

US GDP growth is driven not by the White House, but by AI. The Bank…

24 hours ago

The crypto market has made a breakthrough

The crypto market surges, hitting new highs, with bullish sentiment for Bitcoin and Ethereum amid…

1 day ago

Brent Crude oil Wave Analysis – 13 January 2026

Brent Crude oil ⬆️ Buy - Brent Crude oil rising inside impulse wave c -…

2 days ago

This website uses cookies