Categories: Technical analysis

EURNZD Wave Analysis – 29 May, 2020

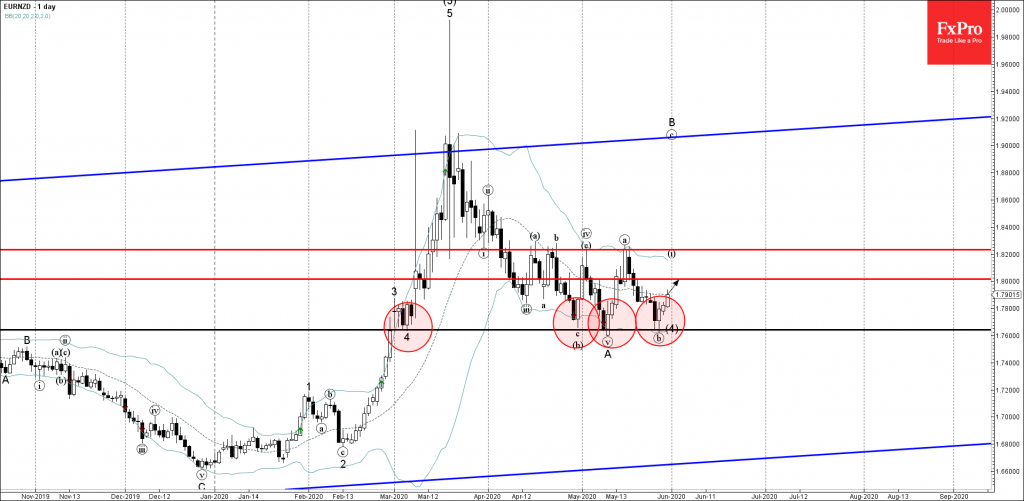
• EURNZD reversed from support area
• Likely to rise to 1.8000

EURNZD rising after the earlier upward reversal from the support area lying between the key support level 1.7645 (which has been reversing the price from March) and the lower daily Bollinger band.

The upward reversal from the support level 1.7645 created the daily strong candlesticks reversal pattern Piercing line – which started the active wave (i).

EURNZD is likely to rise further toward the next round resistance level 1.8000 (61.8% Fibonacci correction of the previous wave (b)).

The FxPro Tech Analysis Team

The FxPro technical experts prepare a daily analysis of the most active currency pairs (majors, crosses, exotics) and commodities. Selected instruments are reviewed on daily trends (D1, H4), using the active Elliott Wave setups, Japanese candlesticks, indicators, and support/resistance levels.

Share
Published by
The FxPro Tech Analysis Team
Tags: EURNZD

Recent Posts

A slightly weaker CPI was not enough to break through the highs

US CPI data a bit softer than forecasts, sparking brief market optimism, but resistance remains.…

2 hours ago

Pro News Flash: Global Tensions Fuel a Fresh Oil Rally

🛢️ Oil prices are finding fresh strength as geopolitical tensions in the Middle East reignite…

3 hours ago

Crude Oil counteracts

Middle East tensions and Venezuelan supply shifts drive Brent crude volatility, with geopolitical risks and…

6 hours ago

Crypto market grows with risk appetite in stocks

Crypto market edges up as risk appetite returns; Bitcoin and Ethereum recover, despite investor caution…

7 hours ago

The yen returned to the Takaichi trade

The dollar resumed its growth after the lawsuit against the Fed chairman. Rumours of early…

8 hours ago

Nat Gas Current situation #tradelikeapro #trading #natgas #tradingstrategy #tradingshorts

Today is Tuesday, the 13th of January, and we will talk about the natural gas…

10 hours ago

This website uses cookies