Categories: Technical analysis

EURNZD Wave Analysis 26 February, 2021

• EURNZD reversed from multi-year support level 1.6410

• Likely to rise to resistance level 1.6800

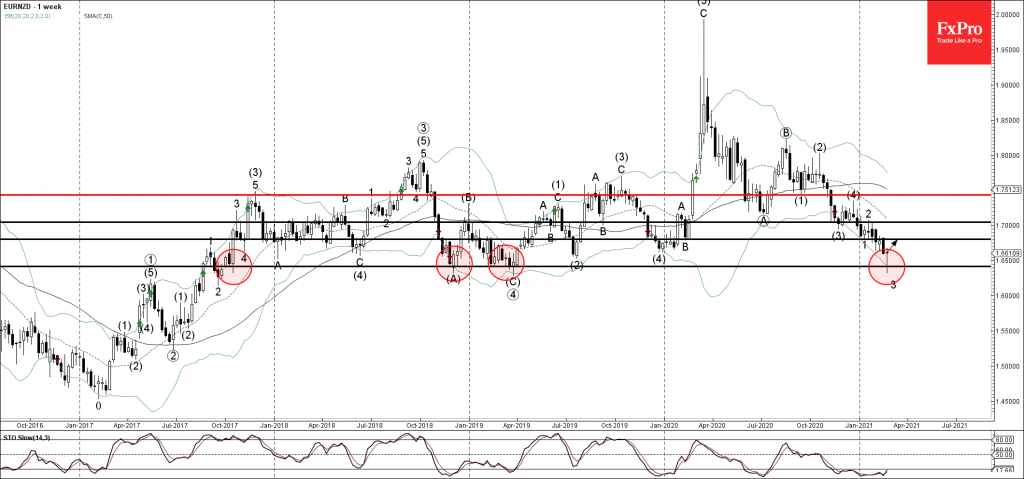
EURNZD recently reversed up from the major support area located between the multi-year support level 1.6410 (which has been reversing the price from the end of 2011) and the lower weekly Bollinger band.

The upward reversal from this support area will most likely form the weekly candlesticks reversal pattern Hammer Doji – strong buy signal for EURNZD – if the pair closes this week near the current levels.

Given the strength of the support level 1.6410 and the oversold weekly Stochastic – EURNZD is likely to rise further toward the next resistance level 1.6800.

The FxPro Tech Analysis Team

The FxPro technical experts prepare a daily analysis of the most active currency pairs (majors, crosses, exotics) and commodities. Selected instruments are reviewed on daily trends (D1, H4), using the active Elliott Wave setups, Japanese candlesticks, indicators, and support/resistance levels.

Share
Published by
The FxPro Tech Analysis Team
Tags: EURNZD

Recent Posts

EURJPY Wave Analysis 2 May 2024

- EURJPY under strong bearish pressure - Likely to fall to support level 163.10 EURJPY…

6 hours ago

WTI crude oil Wave Analysis 2 May 2024

- WTI broke round support level 80.00 - Likely to fall to support level 76.00…

6 hours ago

ADP hints at another strong NFP on Friday

The monthly ADP labour market report showed that America created 192K new jobs in April, above…

1 day ago

Fed’s hawkish tone risks sinking S&P500 to 4700

Bears showed strength ahead of the FOMC decision.  U.S. indices sagged on Tuesday as investors…

2 days ago

A new stage of Bitcoin’s decline

Market Picture  Bitcoin's closing price on Tuesday became the lowest since late February, confirming the…

2 days ago

Ebay Wave Analysis 30 April 2024

- Ebay under the bearish pressure - Likely to fall to support level 51.00 Ebay…

2 days ago

This website uses cookies