Categories: Technical analysis

EURNZD Wave Analysis – 25 September , 2018

  • EURNZD reversed from support zone
  • Further gains are likely

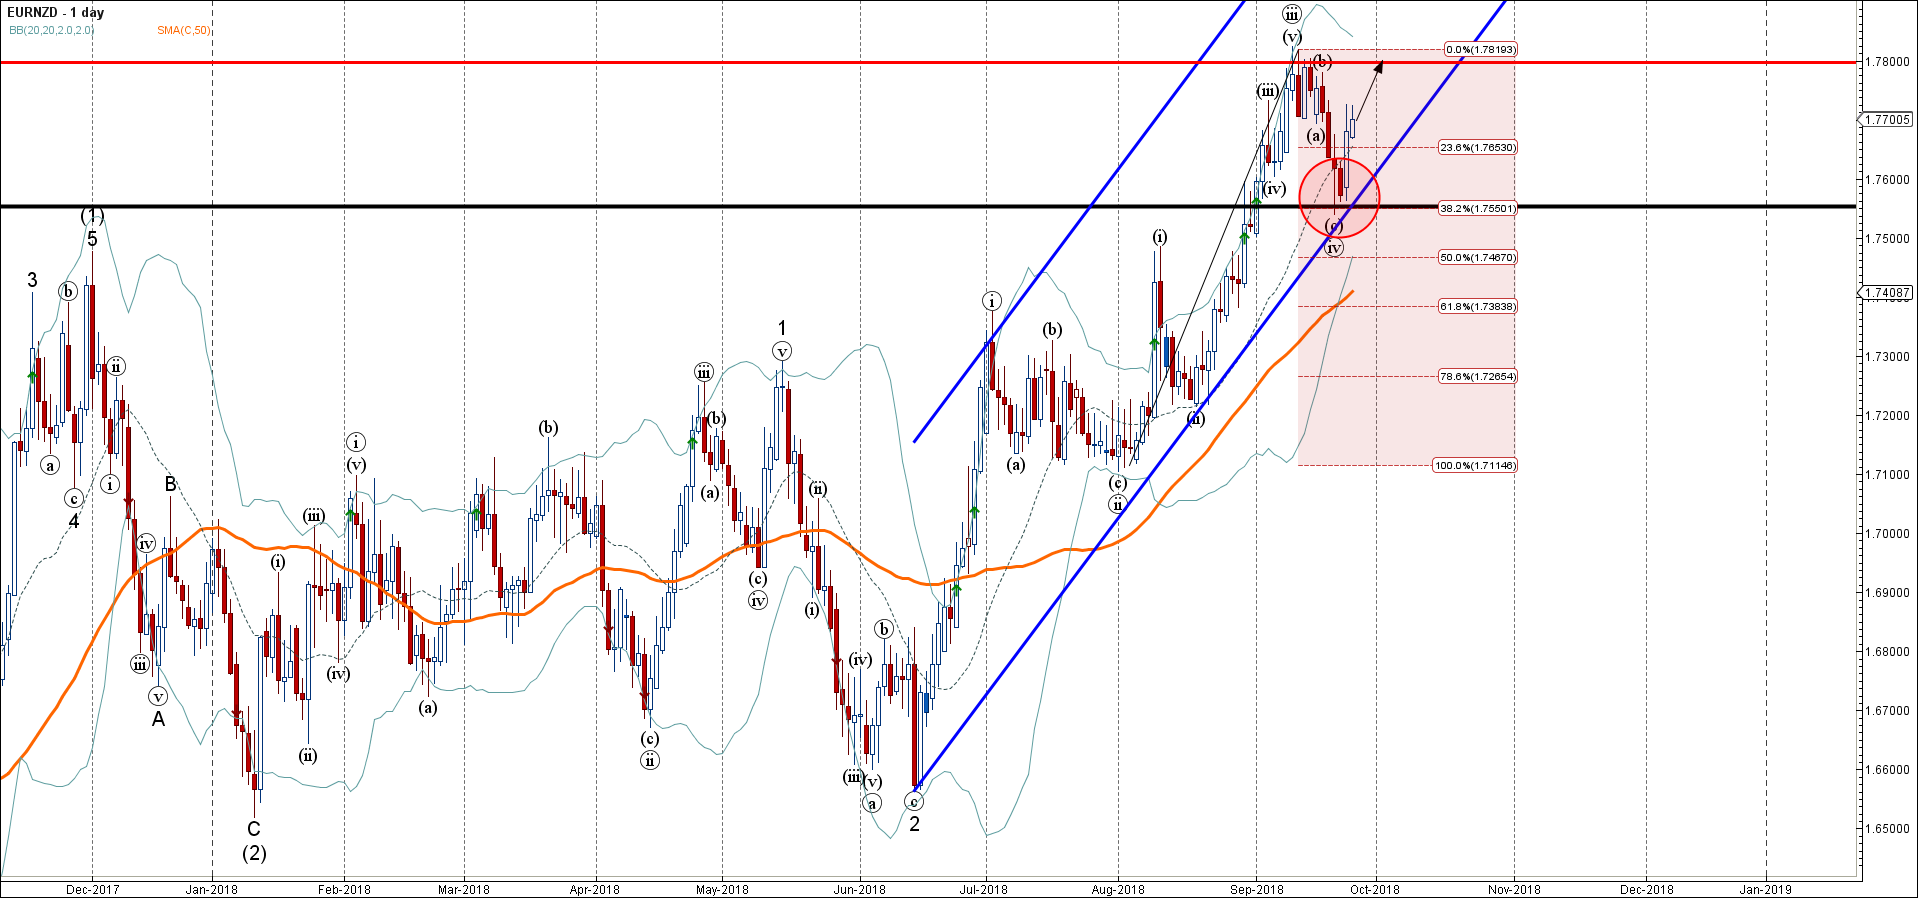
EURNZD continues to rise after the recent upward reversal from the support zone lying between the key support level 1.7550, support trendline of the daily up channel from June and the 38.2% Fibonacci correction of the previous upward impulse from the start of August.

The upward reversal from this support area started the active short-term impulse wave (v), which belongs to the extended impulse wave 3 from the middle of June.

EURNZD is expected to rise further and retest the next resistance level 1.7800 (top of the previous short-term impulse wave (iii) from the start of September).

AddThis Website Tools
The FxPro Tech Analysis Team

The FxPro technical experts prepare a daily analysis of the most active currency pairs (majors, crosses, exotics) and commodities. Selected instruments are reviewed on daily trends (D1, H4), using the active Elliott Wave setups, Japanese candlesticks, indicators, and support/resistance levels.

Share
Published by
The FxPro Tech Analysis Team
Tags: EURNZD

Recent Posts

Video: Dollar and Indices are trying to find footing after the fall

The dollar experienced a sell-off but rallied back up by the end of the week.…

20 hours ago

What is next: BoJ, Fed, SNB & BoE Rates

The new week will be packed with economic data and decisions from key central banks.…

24 hours ago

Dollar attempts to rebound after oversold conditions

Despite economic factors working against the dollar, its oversold condition helped it this week or…

1 day ago

USDCAD Wave Analysis – 14 March 2025

USDCAD: ⬇️ Sell - USDCAD reversed from key resistance level 1.4500 - Likely to fall…

1 day ago

Solana Wave Analysis – 14 March 2025

Solana: ⬆️ Buy - Solana reversed from the long-term support level 113.75 - Likely to…

1 day ago

Adobe Wave Analysis – 13 March 2025

Adobe: ⬇️ Sell - Adobe broke round support level 400.00 - Likely to fall to…

2 days ago