Categories: Technical analysis

EURNZD Wave Analysis – 24 April, 2020

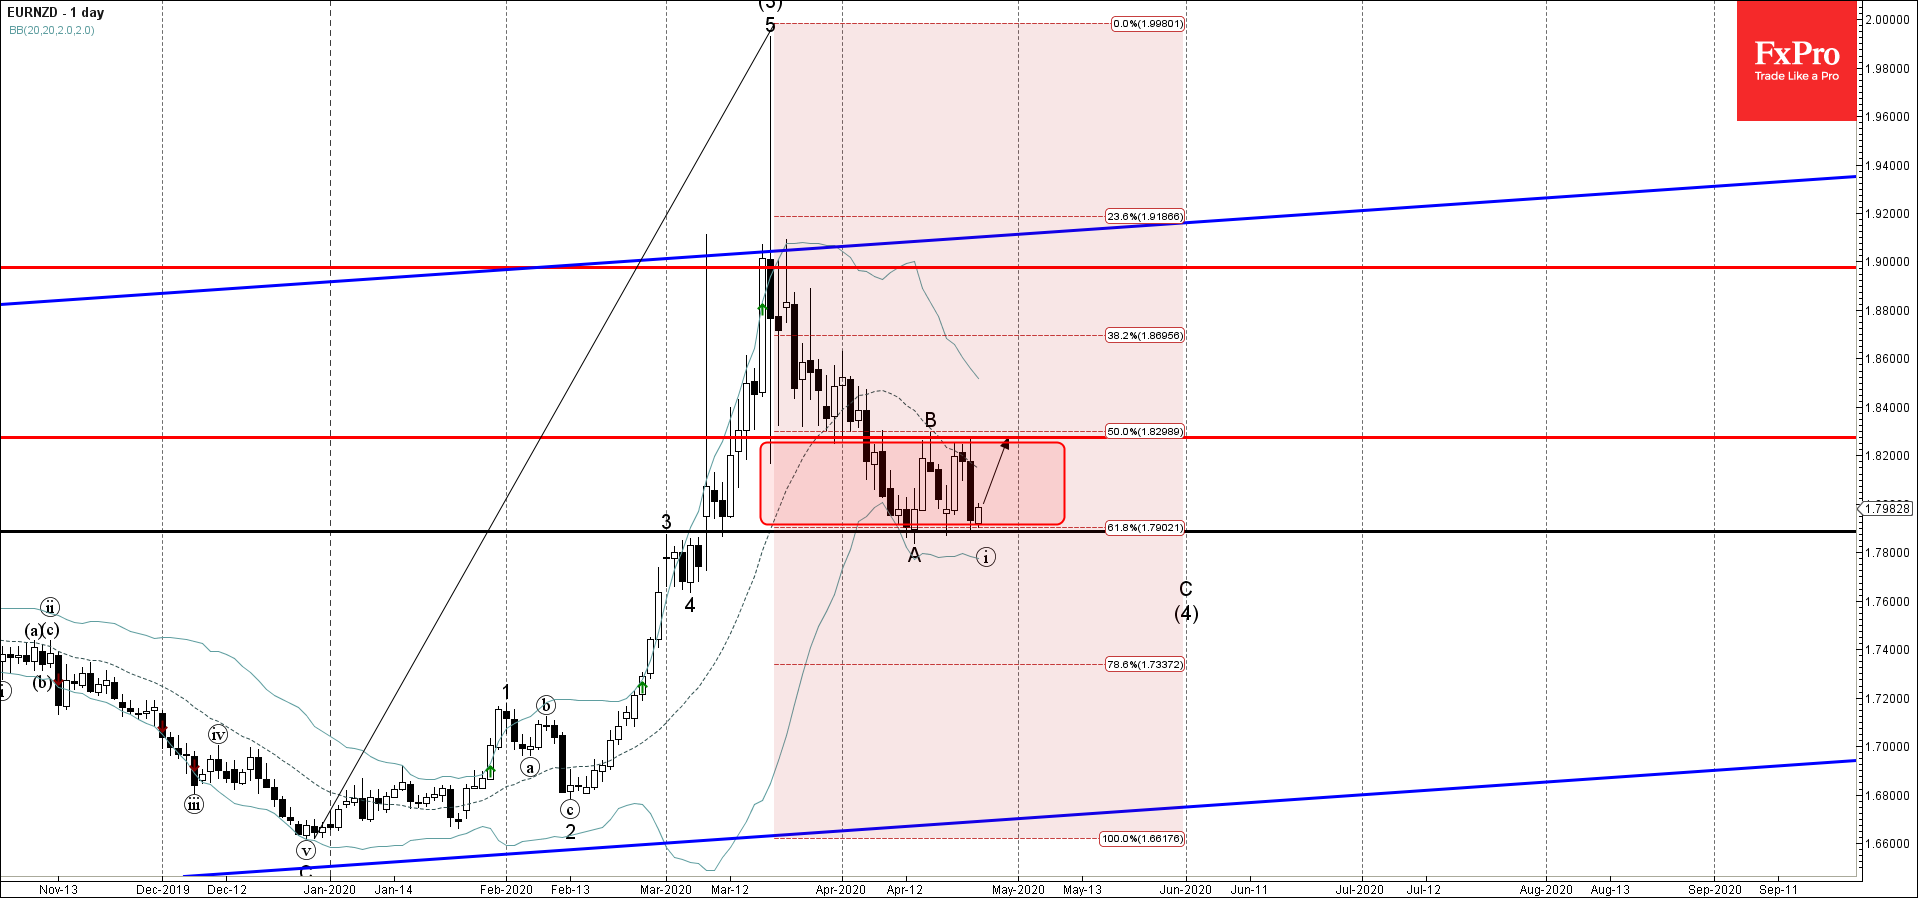
  • EURNZD reversed from support level 1.7890
  • Likely to rise to 1.8270

EURNZD reverently reversed up from the support area lying between the support level 1.7890 (lower boundary of the sideways price range inside which the pair has been trading in the last few trading sessions) and the lower daily Bollinger Band.

The upward reversal from this support area stopped the previous short-term impulse wave (i) of wave C from last week.

EURNZD is expected to rise further toward the next resistance level 1.8270 (upper boundary of this price range).

The FxPro Tech Analysis Team

The FxPro technical experts prepare a daily analysis of the most active currency pairs (majors, crosses, exotics) and commodities. Selected instruments are reviewed on daily trends (D1, H4), using the active Elliott Wave setups, Japanese candlesticks, indicators, and support/resistance levels.

Share
Published by
The FxPro Tech Analysis Team
Tags: EURNZD

Recent Posts

Nikkei 225 index Wave Analysis 20 September 2024

- Nikkei 225 index rising inside minor impulse waves 3 - Likely to reach resistance…

15 hours ago

NZDJPY Wave Analysis 20 September 2024

- NZDJPY rising inside corrective wave ii - Likely to rise to resistance level 91.65…

15 hours ago

Gold terminates the last sceptics

Gold started the week with new highs and ended the week up 1.3%, despite a…

21 hours ago

The Crypto Market’s Steady Ascent

Crypto market cap rose by 3.2% to $2.21 trillion overnight. This made the struggle to…

1 day ago

Gold Wave Analysis 19 September 2024

- Gold reversed from support level 2550.00 - Likely to rise to resistance level 2600.00…

2 days ago

S&P 500 Wave Analysis 19 September 2024

- S&P 500 broke key resistance level 5670.00 - Likely to rise to resistance level…

2 days ago

This website uses cookies