Categories: Technical analysis

EURNZD Wave Analysis 23 August 2023


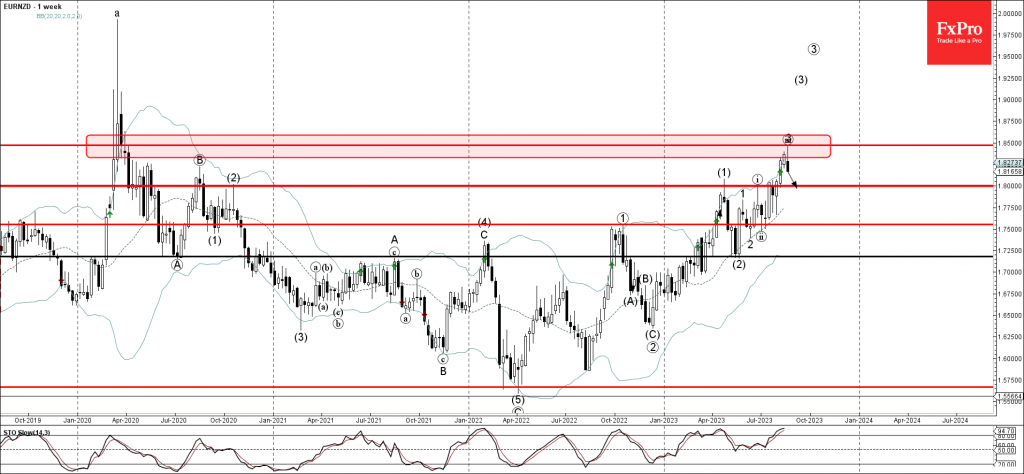
– EURNZD reversed from resistance level 1.8500

– Likely to fall to support level 1.8000.

EURNZD recently reversed down from the key resistance level 1.8500 standing well above with the upper weekly and the daily Bollinger Bands.

The downward reversal from the support level 1.8500 stopped the earlier intermediate impulse wave (3) from June.

Given the strength of the resistance level 1.8500 and the overbought weekly Stochastic, EURNZD can be expected to fall further toward the next round support level 1.8000.

The FxPro Tech Analysis Team

The FxPro technical experts prepare a daily analysis of the most active currency pairs (majors, crosses, exotics) and commodities. Selected instruments are reviewed on daily trends (D1, H4), using the active Elliott Wave setups, Japanese candlesticks, indicators, and support/resistance levels.

Share
Published by
The FxPro Tech Analysis Team
Tags: EURNZD

Recent Posts

Apple Wave Analysis 17 October 2024

- Apple reversed from key resistance level 237.00 - Likely to fall to support level 227.00…

10 hours ago

Aig Wave Analysis 17 October 2024

- Aig reversed from support level 76.60 - Likely to rise to resistance level 79.65 Aig recently…

10 hours ago

The Crypto Market Stabilises at the Top

Market Picture The cryptocurrency market remains steady at around $2.31 trillion in market capitalisation, mirroring…

19 hours ago

GBPCAD Wave Analysis 16 October 2024

- GBPCAD reversed from resistance zone - Likely to fall to support level 1.7750 GBPCAD…

1 day ago

USDCHF Wave Analysis 16 October 2024

- USDCHF broke resistance zone - Likely to rise to resistance level 0.8730 USDCHF currency…

1 day ago

Pound Suppressed by Weak Inflation

The British pound fell below the 1.30 level against the dollar after weak inflation data…

2 days ago

This website uses cookies