Categories: Technical analysis

EURNZD Wave Analysis 12 November, 2020

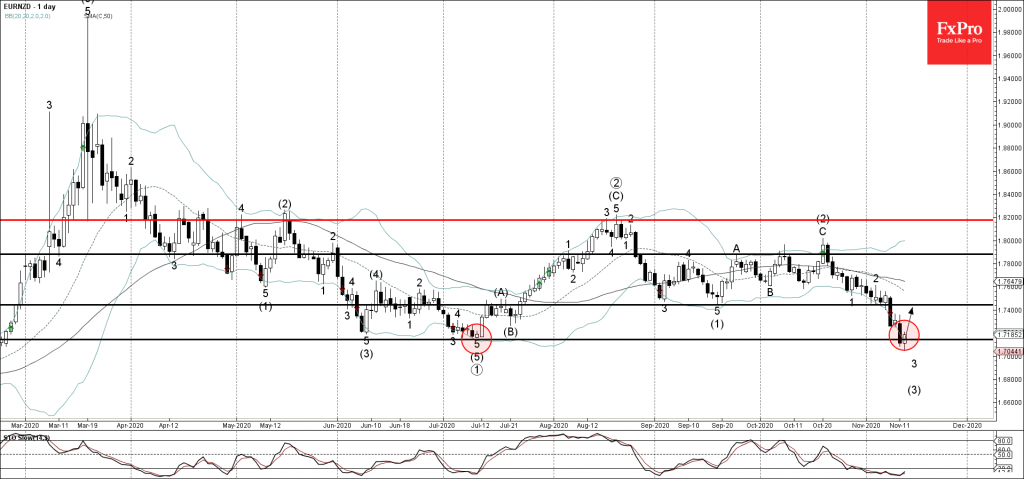
• EURNZD reversed from long-term support level 1.7145

• Likely to rise to 1,7400

EURNZD today reversed up from the support zone located between the long-term support level 1.7145 (which also previously stopped the extended downtrend in July) and the lower daily Bollinger Band.

The upward reversal from this support zone stopped the previous short-term impulse wave 3 of the impulse sequence (3) from October.

EURNZD is likely to rise further toward the next resistance level 1,7400 (former minor support from the start of November).

The FxPro Tech Analysis Team

The FxPro technical experts prepare a daily analysis of the most active currency pairs (majors, crosses, exotics) and commodities. Selected instruments are reviewed on daily trends (D1, H4), using the active Elliott Wave setups, Japanese candlesticks, indicators, and support/resistance levels.

Share
Published by
The FxPro Tech Analysis Team
Tags: EURNZD

Recent Posts

EURUSD at the equilibrium, where will it go next? 

The single currency is trading near $1.076, waiting for further cues and facing serious resistance…

4 hours ago

Bitcoin can’t accelerate but won’t give up trying

Market picture  The crypto market capitalisation fell by 1.7% in 24 hours to $2.29 trillion,…

9 hours ago

USDJPY Wave Analysis 6 May 2024

- USDJPY reversed from support zone - Likely to rise to resistance level 155.65 USDJPY…

24 hours ago

Gold Wave Analysis 6 May 2024

- Gold reversed from support zone - Likely to rise to resistance level 2400.00 Gold…

24 hours ago

Oil Bounces Locally, Global Support 5% below Spot Price

The number of operating oil rigs in the US fell by 7 to 499. This…

1 day ago

Crypto Market Tries to Break Local Downtrend

Market picture  Crypto market capitalisation has been up 2% over the past seven days and…

1 day ago

This website uses cookies