Categories: Technical analysis

EURNZD Wave Analysis – 11 March, 2020

  • EURNZD reversed from resistance area
  • Likely to fall to 1.7500

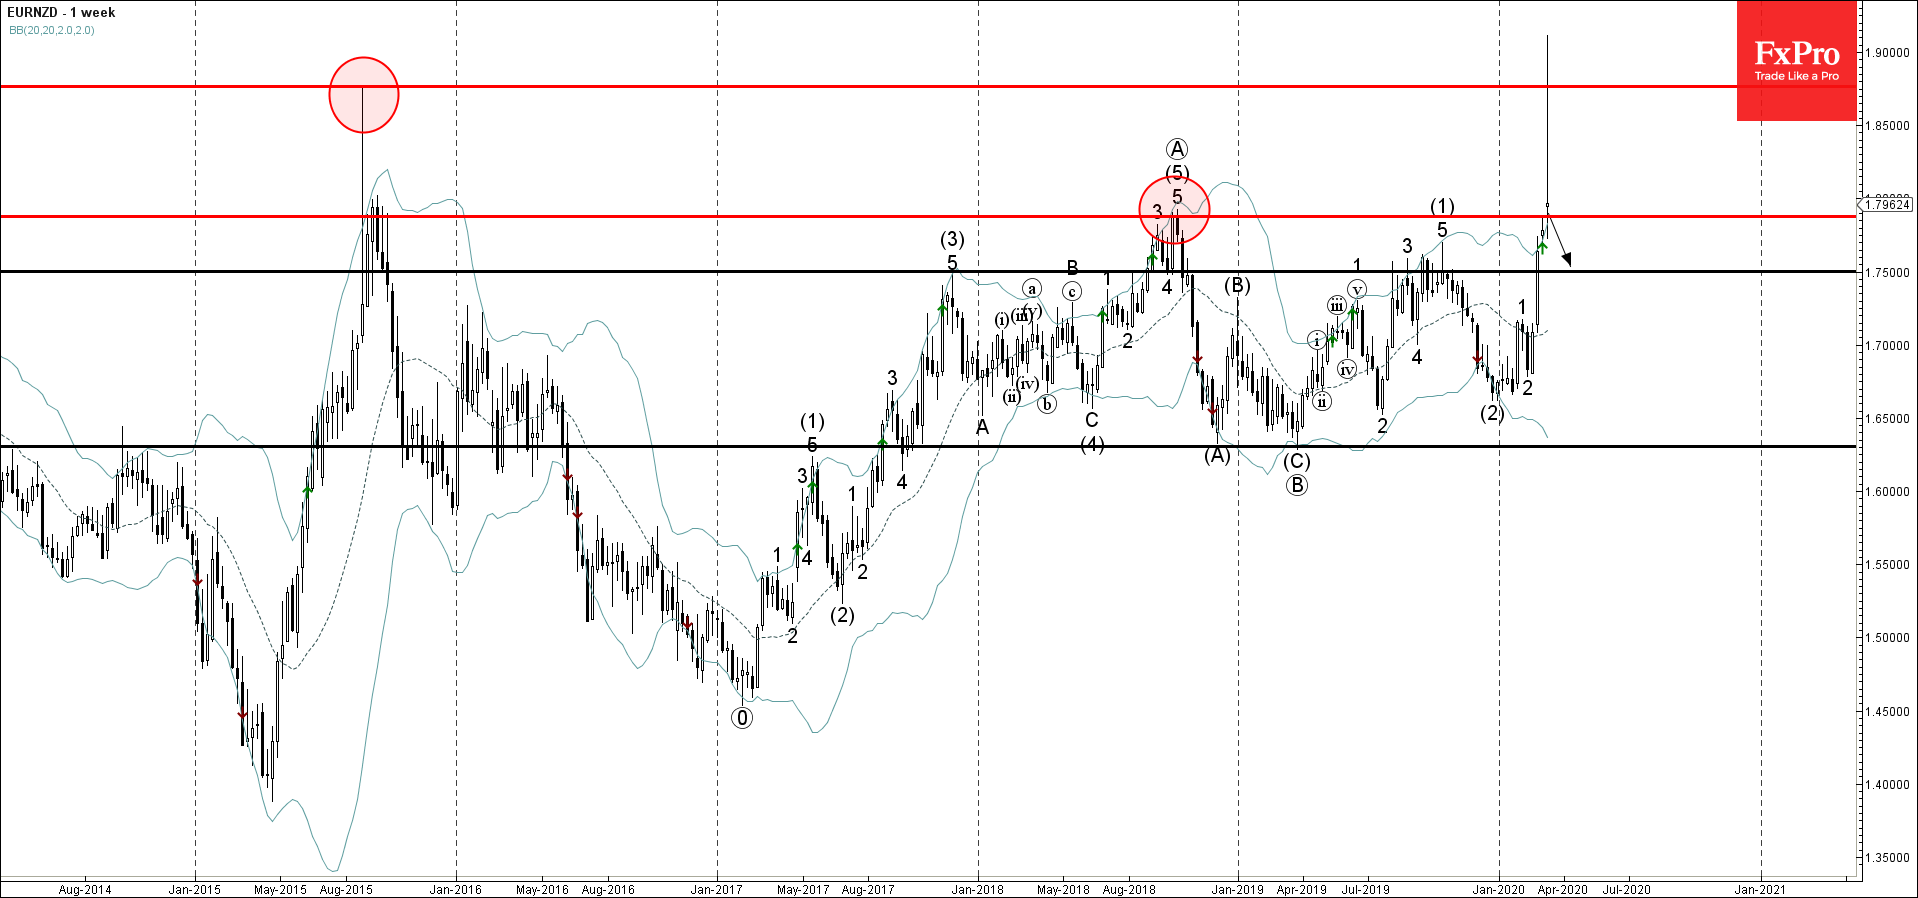
EURNZD recently reversed down from the resistance area lying between the major resistance levels 1.8760 (multi-year high from 2015), 1.7920 (yearly high from 2018) and the upper weekly Bollinger Band.

The downward reversal from this resistance area created the weekly Japanese candlesticks reversal pattern Shooting Star (strong sell signal).

EURNZD is likely to fall further toward the next support level 1.7500 (former resistance from the middle of 2019).

The FxPro Tech Analysis Team

The FxPro technical experts prepare a daily analysis of the most active currency pairs (majors, crosses, exotics) and commodities. Selected instruments are reviewed on daily trends (D1, H4), using the active Elliott Wave setups, Japanese candlesticks, indicators, and support/resistance levels.

Share
Published by
The FxPro Tech Analysis Team
Tags: EURNZD

Recent Posts

Bitcoin aims to break out of a corrective rebound

Crypto market rebounds, Bitcoin eyes $100K, Dash surges, institutional demand rises, and Ethereum staking hits…

16 minutes ago

Bitcoin Wave Analysis – 14 January 2026

Bitcoin: ⬆️ Buy - Bitcoin broke resistance area - Likely to rise to resistance level…

15 hours ago

NZDJPY Wave Analysis – 14 January 2026

NZDJPY: ⬇️ Sell - NZDJPY reversed down from the resistance area - Likely to fall…

15 hours ago

What is Leverage?

Leverage is a mechanism that lets traders control larger positions using smaller capital. By choosing…

20 hours ago

The dollar does not tolerate dissent

US GDP growth is driven not by the White House, but by AI. The Bank…

1 day ago

The crypto market has made a breakthrough

The crypto market surges, hitting new highs, with bullish sentiment for Bitcoin and Ethereum amid…

1 day ago

This website uses cookies