Categories: Technical analysis

EURNZD broke resistance area

  • EURNZD broke resistance area
  • Further gains are likely

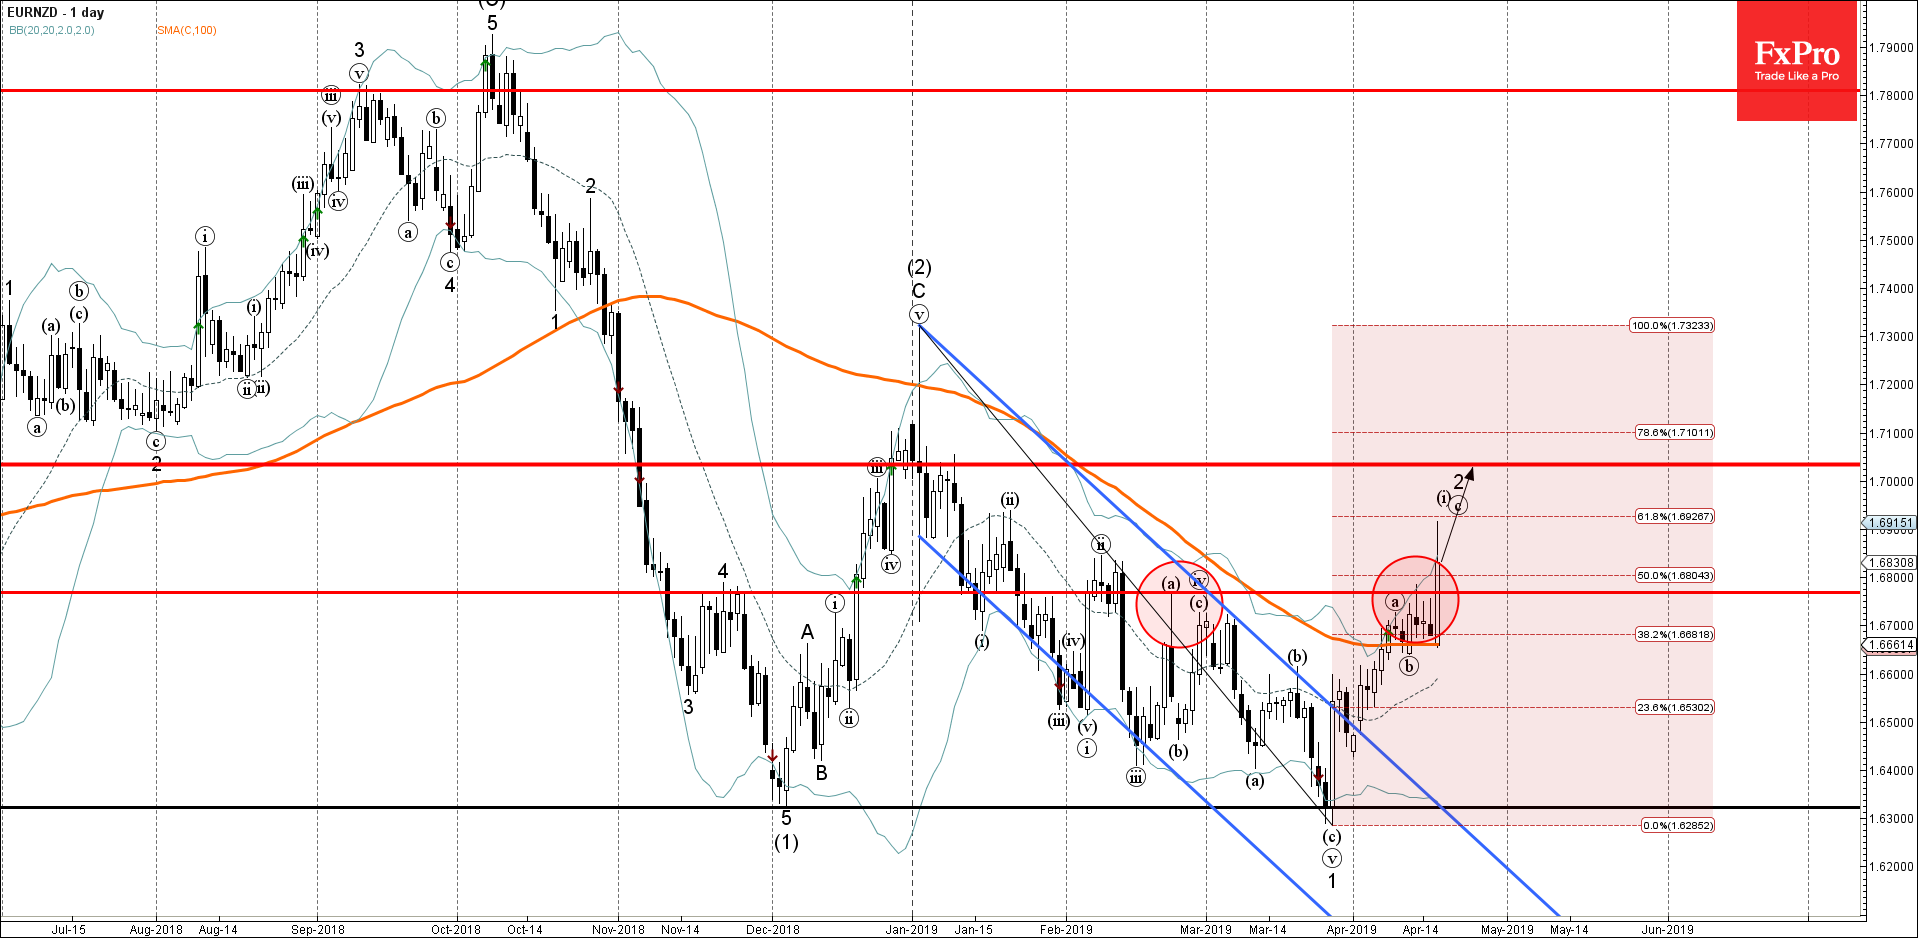
EURNZD today broke through the resistance area lying at the intersection of the resistance level 1.6770 (which has been reversing the price from February) and the 50% Fibonacci correction level of the previous sharp downward impulse from January.

The breakout of this resistance area accelerated the active short-term impulse wave (C) of the ABC correction 2 from the end of March.

EURNZD is expected to rise further and re-test the next round resistance level 1.7000 (target price for the completion of the active wave 2).

The FxPro Tech Analysis Team

The FxPro technical experts prepare a daily analysis of the most active currency pairs (majors, crosses, exotics) and commodities. Selected instruments are reviewed on daily trends (D1, H4), using the active Elliott Wave setups, Japanese candlesticks, indicators, and support/resistance levels.

Share
Published by
The FxPro Tech Analysis Team
Tags: EURNZD

Recent Posts

Solana Wave Analysis – 5 December 2025

Solana: ⬇️ Sell - Solana reversed from resistance zone - Likely to fall to support…

10 minutes ago

EURAUD Wave Analysis – 5 December 2025

EURAUD : ⬇️ Sell - EURAUD broke the support level 1.7600 - Likely to fall…

10 minutes ago

Forex has set its priorities

In 2026, experts favour the yen, see modest euro growth, and expect pressure on the…

4 hours ago

Bear market rebound in crypto is likely to continue

Crypto rebounds continue; Bitcoin faces resistance, with a mixed market outlook ahead, as regulatory changes…

5 hours ago

Coca-Cola Wave Analysis – 4 December 2025

Coca-Cola: ⬇️ Sell - Coca-Cola reversed from long-term resistance level 73.25 - Likely to fall to…

19 hours ago

DraftKings Wave Analysis – 4 December 2025

DraftKings: ⬆️ Buy - DraftKings reversed from support zone - Likely to rise to resistance level…

19 hours ago

This website uses cookies