Categories: Technical analysis

EURNZD Analysis 06 November, 2020

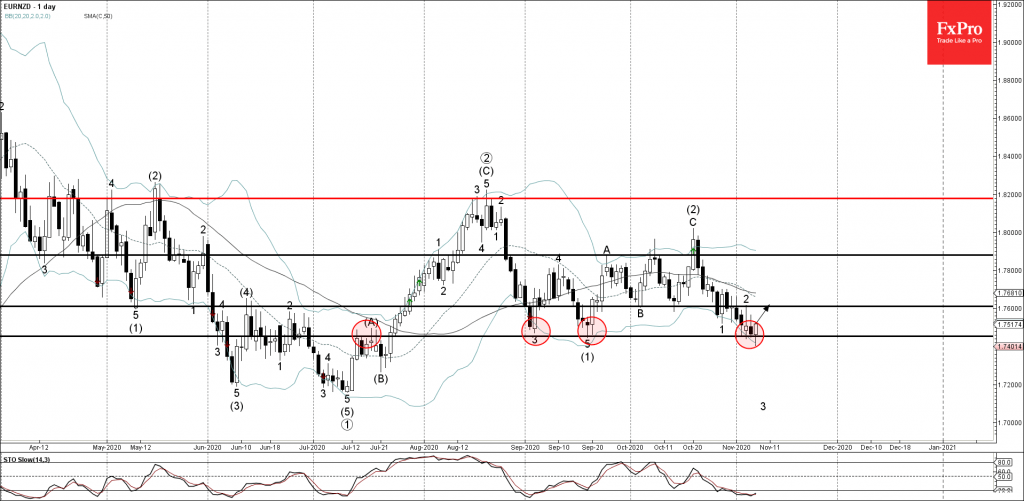
• EURNZD reversed from support area

• Likely to rise to 1.7600                                                                                          

EURNZD recently reversed up from the support area lying between the key support level 1.7450 (which has been reversing the price from September) and the lower daily Bollinger Band.

The upward reversal from this support area will most likely create the daily candlesticks pattern Bullish Engulfing – strong bullish signal for EURNZD.

EURNZD is likely to rise further toward the next resistance level 1.7600 (former top of the previous ABC correction 2 from the start of November).

The FxPro Tech Analysis Team

The FxPro technical experts prepare a daily analysis of the most active currency pairs (majors, crosses, exotics) and commodities. Selected instruments are reviewed on daily trends (D1, H4), using the active Elliott Wave setups, Japanese candlesticks, indicators, and support/resistance levels.

Share
Published by
The FxPro Tech Analysis Team
Tags: EURNZD

Recent Posts

Brent Crude oil Wave Analysis – 13 January 2026

Brent Crude oil ⬆️ Buy - Brent Crude oil rising inside impulse wave c -…

19 minutes ago

USDJPY Wave Analysis – 13 January 2026

USDJPY ⬆️ Buy - USDJPY broke resistance area - Likely to rise to resistance level…

20 minutes ago

Exxon Mobil Wave Analysis – 13 January 2026

Exxon Mobil ⬆️ Buy - Exxon Mobil broke resistance level 125.60 - Likely to rise…

21 minutes ago

BNB Wave Analysis – 13 January 2026

Brent Crude oil ⬆️ Buy - BNB broke out of sideways price range - Likely…

21 minutes ago

A slightly weaker CPI was not enough to break through the highs

US CPI data a bit softer than forecasts, sparking brief market optimism, but resistance remains.…

6 hours ago

Pro News Flash: Global Tensions Fuel a Fresh Oil Rally

🛢️ Oil prices are finding fresh strength as geopolitical tensions in the Middle East reignite…

6 hours ago

This website uses cookies