Categories: Technical analysis

EURNOK Wave Analysis – 19 December , 2018

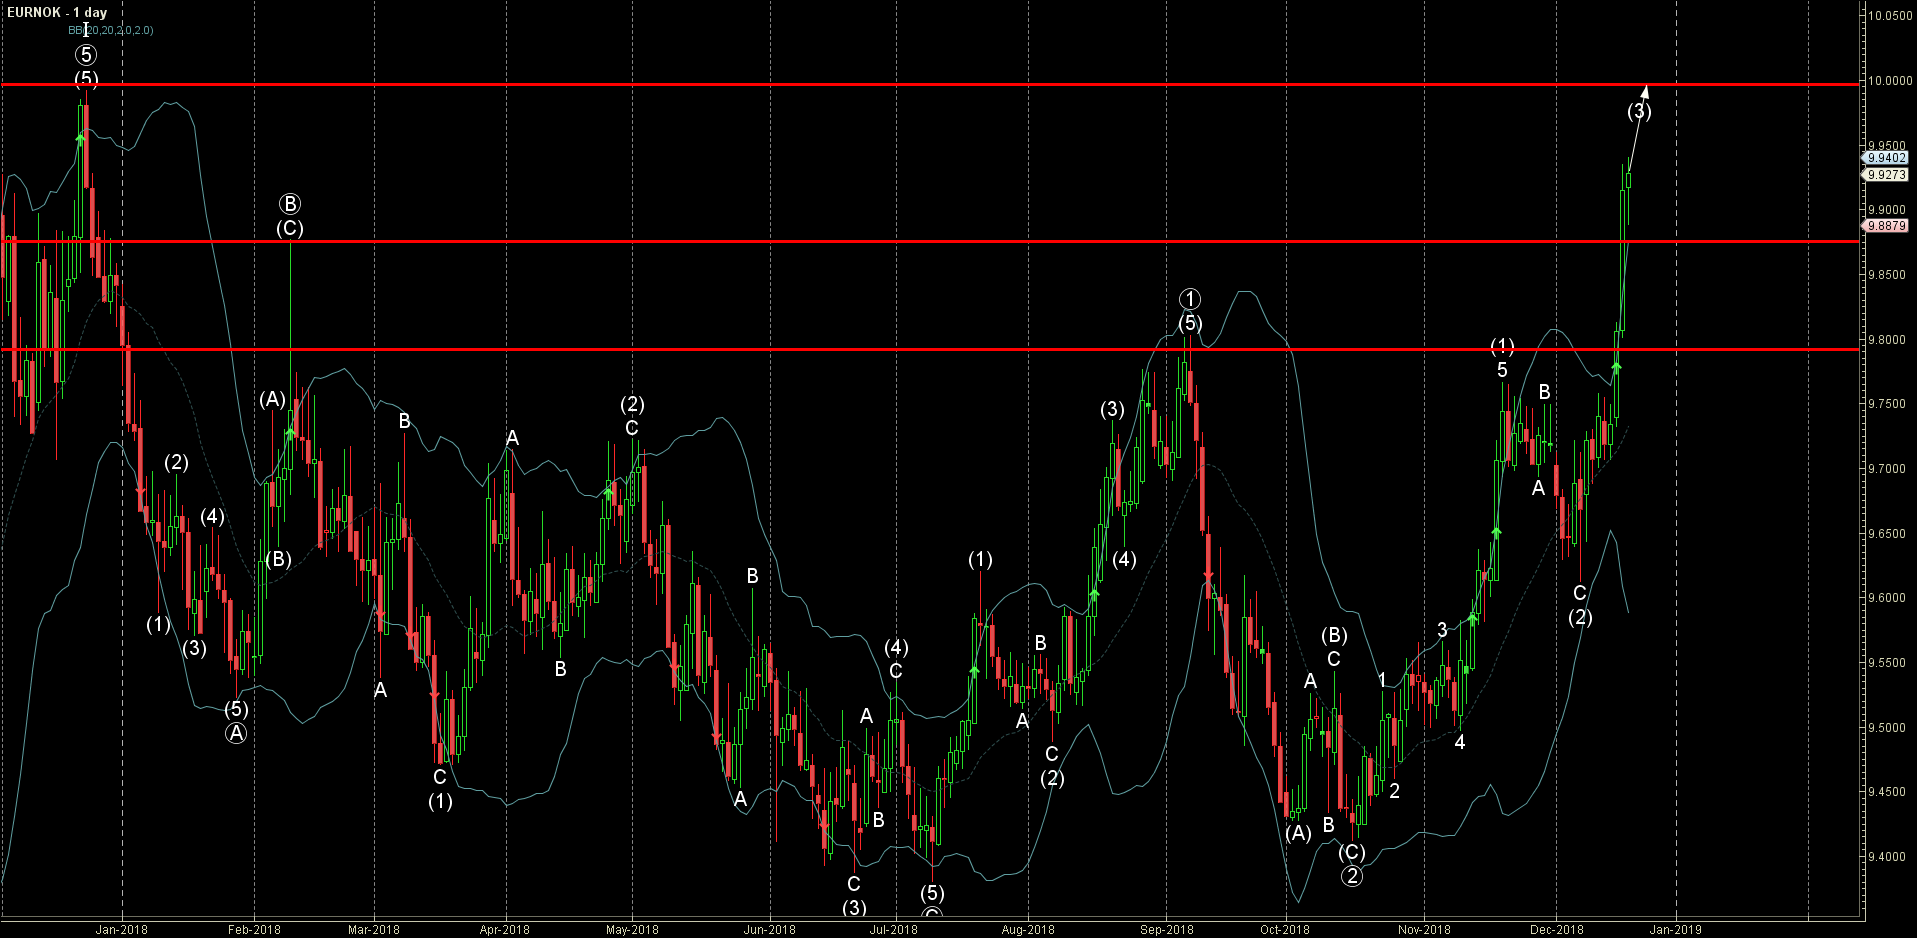
  • EURNOK rising inside sharp impulse wave (3)
  • Further gains are likely

EURNOK rose sharply in the last few trading sessions – breaking through the two successive powerful resistance levels – 9.8750 (monthly high from February) and 9.800 (monthly high from September).

The breakout of these resistance levels strengthened the bullish pressure on EURNOK – which accelerated the active medium-term impulse wave (3) from the start of December.

“EURNOK is expected to rise further and re-test the next round resistance level 10.00 (target price for the completion of the active impulse wave (3))” – the FxPro analyst commented.

AddThis Website Tools
The FxPro Tech Analysis Team

The FxPro technical experts prepare a daily analysis of the most active currency pairs (majors, crosses, exotics) and commodities. Selected instruments are reviewed on daily trends (D1, H4), using the active Elliott Wave setups, Japanese candlesticks, indicators, and support/resistance levels.

Share
Published by
The FxPro Tech Analysis Team
Tags: EURNOK

Recent Posts

Nikkei 225 Wave Analysis – 23 April 2025

Nikkei 225: ⬆️ Buy - Nikkei 225 broke the resistance area - Likely to rise…

9 hours ago

EURCHF Wave Analysis – 23 April 2025

EURCHF: ⬆️ Buy - EURCHF broke the resistance area - Likely to rise to resistance…

9 hours ago

CADJPY Wave Analysis – 23 April 2025

CADJPY: ⬆️ Buy - CADJPY reversed from strong support area - Likely to rise to…

11 hours ago

USDJPY Wave Analysis – 23 April 2025

USDJPY: ⬆️ Buy - USDJPY reversed from the support area - Likely to rise to…

11 hours ago

Europe’s Growth Stalls Again as the Euro Enters Correction Mode

Eurozone business activity slows as falling orders and declining confidence impact growth. Manufacturing PMI remains…

16 hours ago

The Rapid Assault on Crypto

The cryptocurrency market experienced a significant surge, with market capitalisation reaching $2.95 trillion. Bitcoin is…

19 hours ago