Categories: Technical analysis

EURJPY Wave Analysis 26 March, 2021

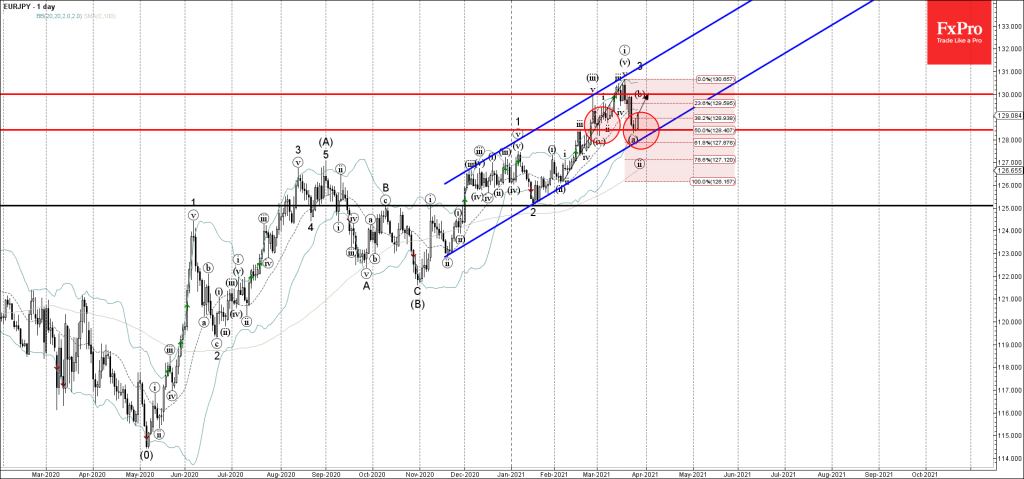
• EURJPY reversed from support level 128.4

• Likely to rise to resistance level 130.00

EURJPY recently reversed up from the support level 128.4 (former resistance from February) – intersecting with the lower daily Bollinger Band and 50% Fibonacci correction of the upward impulse from February.

The upward reversal from this support area started the active short-term impulse wave (b).

EURJPY is likely to rise further toward the next resistance level 130.00 (target price for the completion of the active minor correction (b)).

The FxPro Tech Analysis Team

The FxPro technical experts prepare a daily analysis of the most active currency pairs (majors, crosses, exotics) and commodities. Selected instruments are reviewed on daily trends (D1, H4), using the active Elliott Wave setups, Japanese candlesticks, indicators, and support/resistance levels.

Share
Published by
The FxPro Tech Analysis Team
Tags: EURJPY

Recent Posts

Bitcoin Wave Analysis – 14 January 2026

Bitcoin: ⬆️ Buy - Bitcoin broke resistance area - Likely to rise to resistance level…

8 hours ago

NZDJPY Wave Analysis – 14 January 2026

NZDJPY: ⬇️ Sell - NZDJPY reversed down from the resistance area - Likely to fall…

8 hours ago

What is Leverage?

Leverage is a mechanism that lets traders control larger positions using smaller capital. By choosing…

13 hours ago

The dollar does not tolerate dissent

US GDP growth is driven not by the White House, but by AI. The Bank…

18 hours ago

The crypto market has made a breakthrough

The crypto market surges, hitting new highs, with bullish sentiment for Bitcoin and Ethereum amid…

19 hours ago

Brent Crude oil Wave Analysis – 13 January 2026

Brent Crude oil ⬆️ Buy - Brent Crude oil rising inside impulse wave c -…

1 day ago

This website uses cookies