Categories: Technical analysis

EURJPY Wave Analysis 22 January, 2021

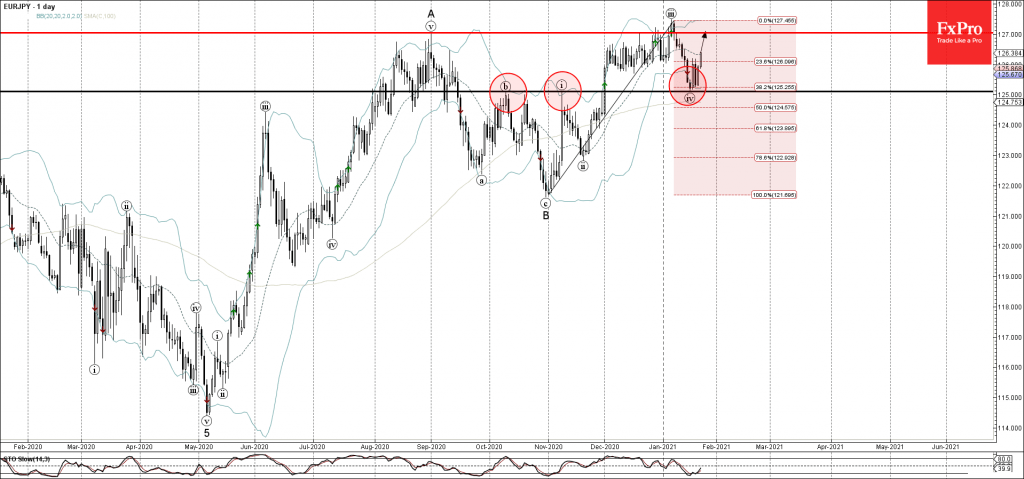
• EURJPY reversed from key support level 125.00

• Likely to rise to 127.00

EURJPY recently reversed up from the key support level 125.00 (former monthly high from October and November) – standing near the lower daily Bollinger Band and the 38.2% Fibonacci correction level of the previous upward impulse from October.

The upward reversal from this support level created the daily Morning Star candlesticks reversal pattern – which was immediately followed by the Bullish Engulfing.

EURJPY is expected to rise further toward the next resistance level 127.00 (which stopped the sharp uptrend in last August).

The FxPro Tech Analysis Team

The FxPro technical experts prepare a daily analysis of the most active currency pairs (majors, crosses, exotics) and commodities. Selected instruments are reviewed on daily trends (D1, H4), using the active Elliott Wave setups, Japanese candlesticks, indicators, and support/resistance levels.

Share
Published by
The FxPro Tech Analysis Team
Tags: EURJPY

Recent Posts

The dollar does not tolerate dissent

US GDP growth is driven not by the White House, but by AI. The Bank…

4 hours ago

The crypto market has made a breakthrough

The crypto market surges, hitting new highs, with bullish sentiment for Bitcoin and Ethereum amid…

4 hours ago

Brent Crude oil Wave Analysis – 13 January 2026

Brent Crude oil ⬆️ Buy - Brent Crude oil rising inside impulse wave c -…

18 hours ago

USDJPY Wave Analysis – 13 January 2026

USDJPY ⬆️ Buy - USDJPY broke resistance area - Likely to rise to resistance level…

18 hours ago

Exxon Mobil Wave Analysis – 13 January 2026

Exxon Mobil ⬆️ Buy - Exxon Mobil broke resistance level 125.60 - Likely to rise…

18 hours ago

BNB Wave Analysis – 13 January 2026

Brent Crude oil ⬆️ Buy - BNB broke out of sideways price range - Likely…

18 hours ago

This website uses cookies