Categories: Technical analysis

EURJPY Wave Analysis – 21 August, 2020

• EURJPY reversed from resistance level 126.60

• Likely to fall to 124.00

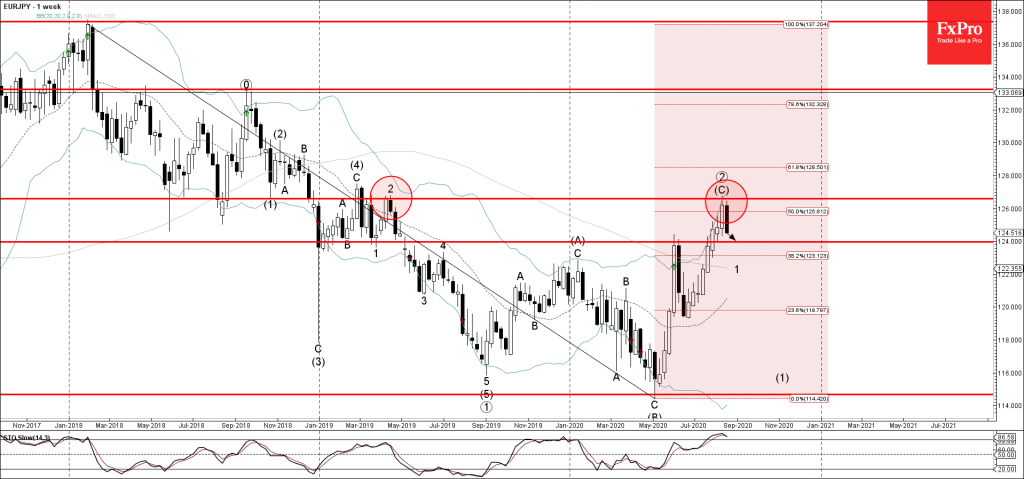
EURJPY recently reversed down from the powerful multi-month resistance level 126.60 (top of wave 2 from the start of 2019) – standing close to the upper weekly Bollinger Band and the 50% Fibonacci correction of the weekly downtrend from 2018.

The downward reversal from the resistance level 126.60 stopped the previous sharp upward impulse wave (C).

With the overbought weekly Stochastic – EURJPY is likely to fall further toward the next support level 124.00 (former strong resistance level from June).

AddThis Website Tools
The FxPro Tech Analysis Team

The FxPro technical experts prepare a daily analysis of the most active currency pairs (majors, crosses, exotics) and commodities. Selected instruments are reviewed on daily trends (D1, H4), using the active Elliott Wave setups, Japanese candlesticks, indicators, and support/resistance levels.

Share
Published by
The FxPro Tech Analysis Team
Tags: EURJPY

Recent Posts

What is next: Australia Rate, EU CPI, US NFP

Europe will switch to daylight saving time next week. Key events include the RBA's rate…

2 hours ago

Dollar under tariffs pressure

The US dollar showed a hesitant upward trend, facing resistance as it approached technical obstacles.

4 hours ago

Pfizer Wave Analysis – 27 March 2025

Pfizer: ⬇️ Sell - Pfizer broke support level 25.20 - Likely to fall to support level…

17 hours ago

Silver Wave Analysis – 27 March 2025

Silver: ⬆️ Buy - Silver broke resistance area - Likely to rise to resistance level…

17 hours ago

EURGBP Wave Analysis – 27 March 2025

EURGBP: ⬇️ Sell - EURGBP broke support area - Likely to fall to support level…

21 hours ago

3M Wave Analysis – 27 March 2025

3M: ⬇️ Sell - 3M reversed from resistance area - Likely to fall to support…

21 hours ago