Categories: Technical analysis

EURJPY Wave Analysis 19 March 2024

– EURJPY broke pivotal resistance level 163.40

 – Likely to rise to resistance level 164.35

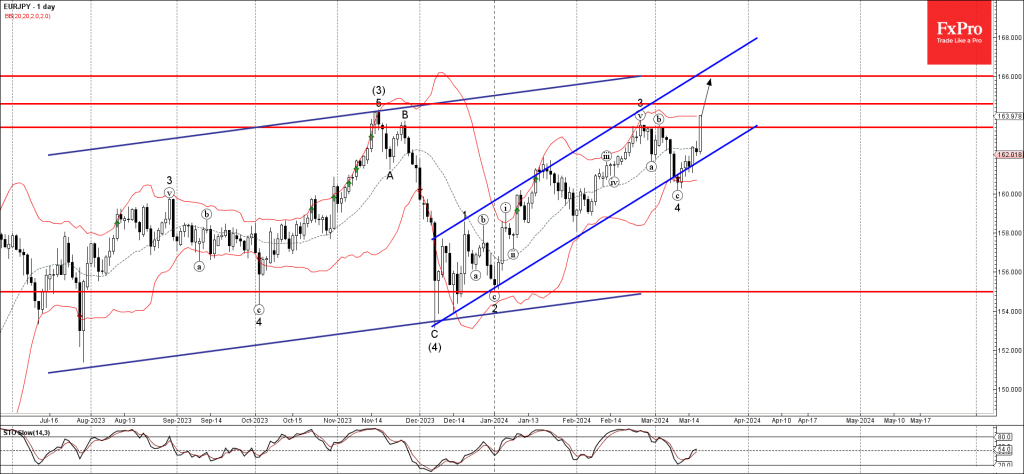
EURJPY today broke above the pivotal resistance level 163.40 (which stopped the previous waves 3 and (b), as can be seen from the daily EURJPY chart below).

The breakout of the resistance level 163.40 continues the active minor impulse wave 5 of the intermediate impulse wave (5) from the start of December.

Given the clear daily uptrend, EURJPY currency pair can be expected to rise further toward the next resistance level 164.35 (top of wave (3) from November) – followed by 166.00.

AddThis Website Tools
The FxPro Tech Analysis Team

The FxPro technical experts prepare a daily analysis of the most active currency pairs (majors, crosses, exotics) and commodities. Selected instruments are reviewed on daily trends (D1, H4), using the active Elliott Wave setups, Japanese candlesticks, indicators, and support/resistance levels.

Share
Published by
The FxPro Tech Analysis Team
Tags: EURJPY

Recent Posts

Bitcoin Wave Analysis – 22 April 2025

Bitcoin: ⬆️ Buy - Bitcoin broke round resistance level 90000.00 - Likely to rise to…

12 hours ago

AUDUSD Wave Analysis – 22 April 2025

AUDUSD: ⬇️ Sell - AUDUSD reversed from the key resistance level 0.6400 - Likely to…

12 hours ago

Crypto Market Escapes from Fear

Market Overview The crypto market has gained around 2% over the past seven days, with…

1 day ago

Nike Wave Analysis – 21 April 2025

Nike: ⬆️ Buy - Nike reversed from the long-term support level 52.60 - Likely to…

1 day ago

Natural Gas Wave Analysis – 21 April 2025

Natural gas: ⬇️ Sell Natural gas broke support area Likely to fall to support level…

1 day ago

EURUSD Wave Analysis – 21 April 2025

EURUSD: ⬆️ Buy - EURUSD broke the resistance area - Likely to test resistance level…

2 days ago