Categories: Technical analysis

EURJPY Wave Analysis 15 October 2024

– EURJPY reversed from the resistance zone

– Likely to fall to support level 160.90

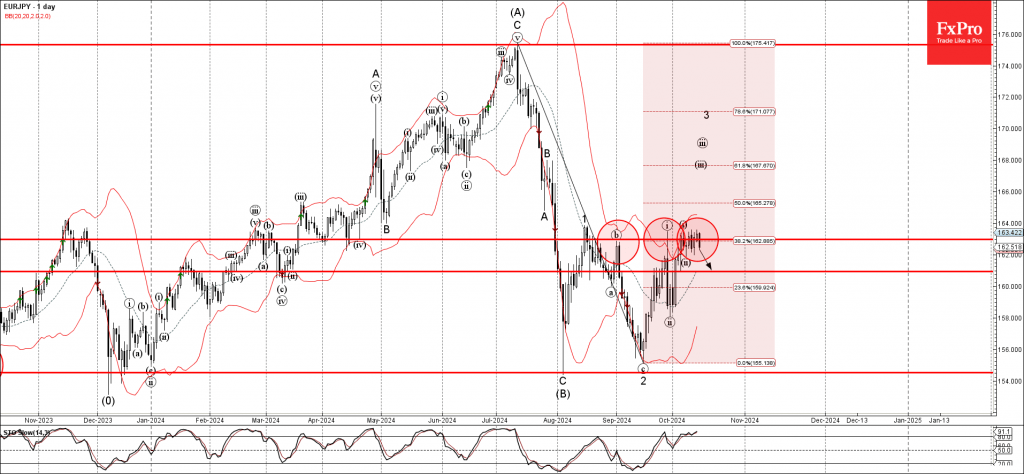
EURJPY currency pair recently reversed down from the resistance zone located between the key resistance level 163.00 (which has been reversing the price from the end of September), the upper daily Bollinger Band and the 38.2% Fibonacci correction of the downward impulse from July.

The downward reversal from this resistance zone stopped the earlier short-term impulse waves iii, 3 – which belong to the impulse wave (C) from August.

Given the overbought daily Stochastic, EURJPY can be expected to fall further to the next support level 160.90 (former minor support from the start of October).

AddThis Website Tools
The FxPro Tech Analysis Team

The FxPro technical experts prepare a daily analysis of the most active currency pairs (majors, crosses, exotics) and commodities. Selected instruments are reviewed on daily trends (D1, H4), using the active Elliott Wave setups, Japanese candlesticks, indicators, and support/resistance levels.

Share
Published by
The FxPro Tech Analysis Team
Tags: EURJPY

Recent Posts

Adobe Wave Analysis – 13 March 2025

Adobe: ⬇️ Sell - Adobe broke round support level 400.00 - Likely to fall to…

21 minutes ago

Apple Wave Analysis – 13 March 2025

Apple: ⬇️ Sell - Apple broke support area - Likely to fall to support level…

22 minutes ago

Gold Wave Analysis – 13 March 2025

Gold: ⬆️ Buy - Gold broke resistance level 2962.00 - Likely to rise to resistance…

1 hour ago

EURGBP Wave Analysis – 13 March 2025

EURGBP: ⬇️ Sell - EURGBP reversed from key resistance level 0.8450 - Likely to fall…

1 hour ago

Gold climbs on lower rate speculations

The gold price has resumed updating its all-time highs on the back of speculations around…

7 hours ago

Crypto: just a bumpy downtrend

The crypto market experienced a drop, but towards the end of the week, there was…

8 hours ago