Categories: Technical analysis

EURJPY Wave Analysis 13 October, 2020

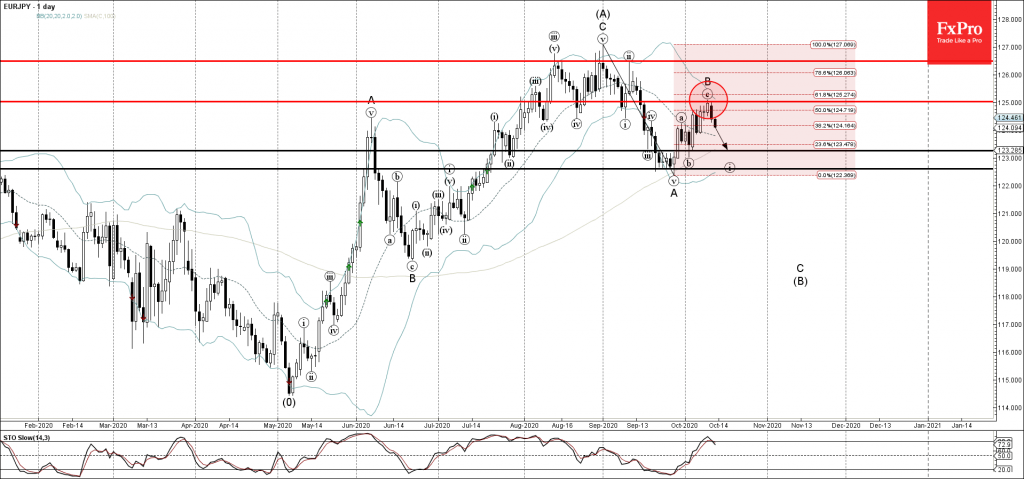
• EURJPY reversed from resistance area

• Likely to fall to 123.25

EURJPY recently reversed down with the daily Bearish Engulfing from the resistance area lying between the resistance level 125.00, upper daily Bollinger band and the 50% Fibonacci correction of the downward impulse A from September.

The downward reversal from this resistance area stopped the previous short-term ABC correction B.

EURJPY is likely to fall further toward the next support level 123.25 (which stopped the previous minor correction (b) at the start of October).

The FxPro Tech Analysis Team

The FxPro technical experts prepare a daily analysis of the most active currency pairs (majors, crosses, exotics) and commodities. Selected instruments are reviewed on daily trends (D1, H4), using the active Elliott Wave setups, Japanese candlesticks, indicators, and support/resistance levels.

Share
Published by
The FxPro Tech Analysis Team
Tags: EURJPY

Recent Posts

Ebay Wave Analysis 30 April 2024

- Ebay under the bearish pressure - Likely to fall to support level 51.00 Ebay…

8 hours ago

GBPAUD Wave Analysis 30 April 2024

- GBPAUD reversed from key support level 1.9135 - Likely to rise to resistance level…

8 hours ago

Silver: a possible long road down

Silver has lost 2.6% since the start of the day on Tuesday to $26.4 per…

11 hours ago

Another Dip in Crypto Capitalization

Market picture  The crypto market capitalisation decreased by another 1.5% to $2.27 trillion, getting closer…

15 hours ago

ANF Wave Analysis 29 April 2024

ANF reversed from key support level 113.40 Likely to rise to resistance level 132.31 ANF…

1 day ago

GBPUSD Wave Analysis 29 April 2024

- GBPUSD rising inside minor correction 2 - Likely to rise to resistance level 1.2700…

1 day ago

This website uses cookies