Categories: Technical analysis

EURGBP Wave Analysis – 9 April 2025

EURGBP: ⬆️ Buy

– EURGBP broke the resistance zone

– Likely to rise to resistance level 0.8700

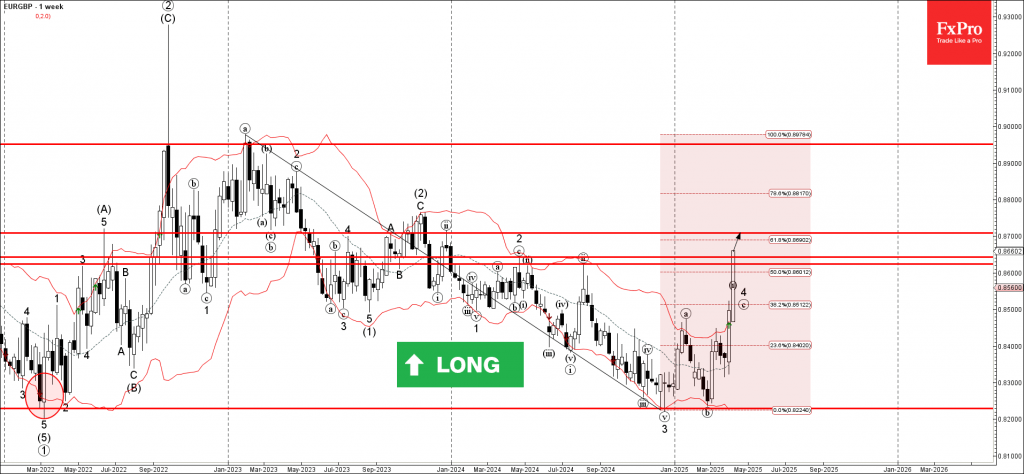
EURGBP currency pair recently broke through the long-term resistance zone located between the resistance levels 0.8625 (multi-month high from last August) and 0.8645 (strong resistance from April of 2024).

The breakout of this resistance zone accelerated the c-wave of the active weekly upward ABC correction 4 from the end of September.

Given the strongly bearish sterling sentiment seen recently, EURGBP currency pair can be expected to rise to the next resistance level 0.8700 (earlier resistance from December of 2023).

The FxPro Tech Analysis Team

The FxPro technical experts prepare a daily analysis of the most active currency pairs (majors, crosses, exotics) and commodities. Selected instruments are reviewed on daily trends (D1, H4), using the active Elliott Wave setups, Japanese candlesticks, indicators, and support/resistance levels.

Share
Published by
The FxPro Tech Analysis Team
Tags: EURGBP

Recent Posts

CHFJPY Wave Analysis – 9 January 2026

CHFJPY: ⬆️ Buy - CHFJPY reversed from support area - Likely to rise to resistance…

1 day ago

Exxon Mobil Wave Analysis – 9 January 2026

Exxon Mobil: ⬆️ Buy - Exxon Mobil reversed from support area - Likely to rise…

1 day ago

Pro News Weekly: Dollar Rebounds as Markets Test New Limits

Welcome to Pro News Weekly! Here’s what is shaping the markets: 💵 The U.S. dollar…

1 day ago

Geopolitics will destroy the euro

•    EURUSD falls due to geopolitics and expectations of tariff removal •    Gold returns to…

2 days ago

Platinum Wave Analysis – 8 January 2026

Platinum: ⬇️ Sell - Platinum reversed from pivotal resistance level 150.00 - Likely to fall to…

2 days ago

Baidu Wave Analysis – 8 January 2026

Baidu: ⬇️ Sell - Baidu reversed from resistance zone - Likely to fall to support level…

2 days ago

This website uses cookies