Categories: Technical analysis

EURGBP Wave Analysis 3 May 2024

– EURGBP reversed from support zone

– Likely to rise to resistance level 0.8625

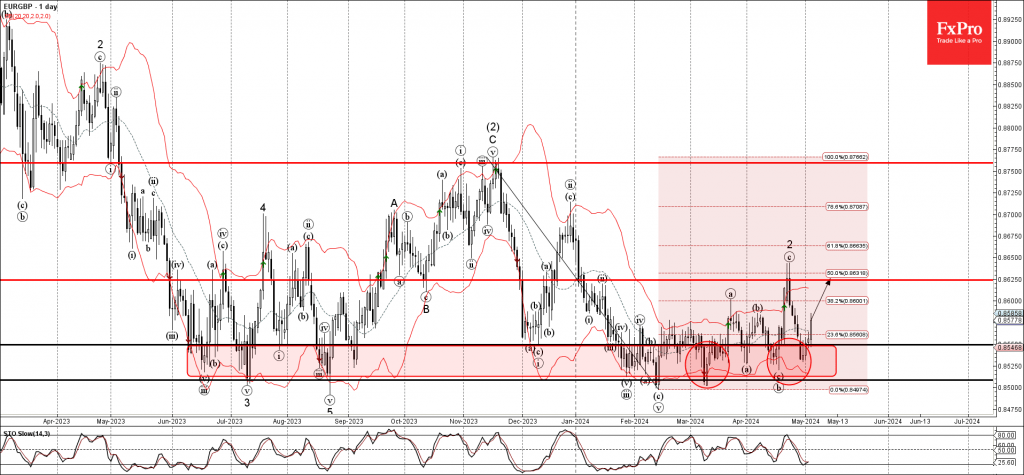
EURGBP recently reversed up from the support zone lying between the key support levels 0.8500, 0.8550 and the lower daily Bollinger Band.

The upward reversal from this support zone created the daily Japanese candlesticks reversal pattern Morning Star Doji.

EURGBP can be expected to rise further to the next resistance level 0.8625 (which has been reversing the price from January).

AddThis Website Tools
The FxPro Tech Analysis Team

The FxPro technical experts prepare a daily analysis of the most active currency pairs (majors, crosses, exotics) and commodities. Selected instruments are reviewed on daily trends (D1, H4), using the active Elliott Wave setups, Japanese candlesticks, indicators, and support/resistance levels.

Share
Published by
The FxPro Tech Analysis Team
Tags: EURGBP

Recent Posts

Crypto Market Escapes from Fear

Market Overview The crypto market has gained around 2% over the past seven days, with…

11 hours ago

Nike Wave Analysis – 21 April 2025

Nike: ⬆️ Buy - Nike reversed from the long-term support level 52.60 - Likely to…

22 hours ago

Natural Gas Wave Analysis – 21 April 2025

Natural gas: ⬇️ Sell Natural gas broke support area Likely to fall to support level…

22 hours ago

EURUSD Wave Analysis – 21 April 2025

EURUSD: ⬆️ Buy - EURUSD broke the resistance area - Likely to test resistance level…

1 day ago

USDJPY Wave Analysis – 21 April 2025

USDJPY: ⬇️ Sell - USDJPY broke support area - Likely to fall to support level…

1 day ago

What is next: Euro Area PMI and US Durable Goods Orders

The following economic data events are worth paying attention to in the new week. Wednesday…

1 day ago