Categories: Technical analysis

EURGBP Wave Analysis – 29 September, 2022

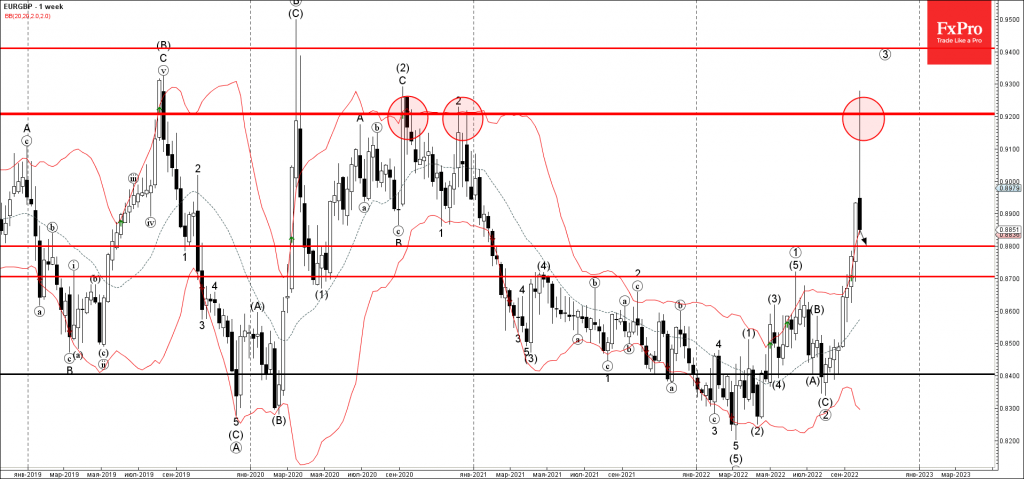
• EURGBP reversed from long-term resistance level 0.9200

• Likely to fall to support level 0.8800

EURGBP falling after the pair reversed down from the powerful long-term resistance level 0.9200 (which has been reversing the price from the middle of 2020), standing far above the upper weekly Bollinger Band.

The downward reversal from the resistance level 0.9200 is currently forming the strong weekly Candlesticks reversal pattern Falling Star.

EURGBP currency pair can be expected to fall further toward the next support level 0.8800.

The FxPro Tech Analysis Team

The FxPro technical experts prepare a daily analysis of the most active currency pairs (majors, crosses, exotics) and commodities. Selected instruments are reviewed on daily trends (D1, H4), using the active Elliott Wave setups, Japanese candlesticks, indicators, and support/resistance levels.

Share
Published by
The FxPro Tech Analysis Team
Tags: EURGBP

Recent Posts

ADP hints at another strong NFP on Friday  

The monthly ADP labour market report showed that America created 192K new jobs in April, above…

2 hours ago

Fed’s hawkish tone risks sinking S&P500 to 4700

Bears showed strength ahead of the FOMC decision.  U.S. indices sagged on Tuesday as investors…

5 hours ago

A new stage of Bitcoin’s decline

Market Picture  Bitcoin's closing price on Tuesday became the lowest since late February, confirming the…

9 hours ago

Ebay Wave Analysis 30 April 2024

- Ebay under the bearish pressure - Likely to fall to support level 51.00 Ebay…

22 hours ago

GBPAUD Wave Analysis 30 April 2024

- GBPAUD reversed from key support level 1.9135 - Likely to rise to resistance level…

22 hours ago

Silver: a possible long road down

Silver has lost 2.6% since the start of the day on Tuesday to $26.4 per…

1 day ago

This website uses cookies