Categories: Technical analysis

EURGBP Wave Analysis 29 August 2023

– EURGBP broke resistance level 0.8590

– Likely to test resistance level 0.8655

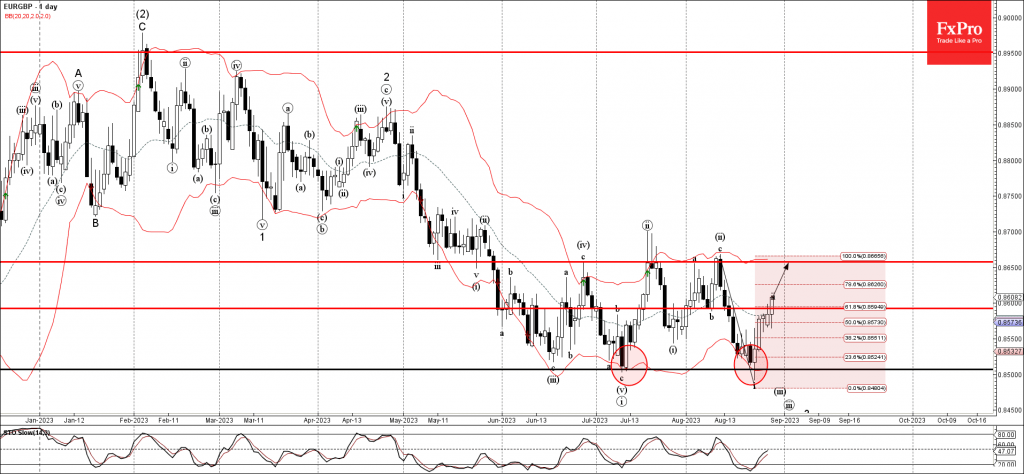
EURGBP currency pair recently broke above key resistance level 0.8590, intersecting with the 61.8% Fibonacci correction of the downward impulse from the start of August.

The breakout of the resistance level 0.8590 accelerated the active short-term correction ii.

Given the strong sterling sales across the FX markets, EURGBP currency pair can be expected to rise further toward the next resistance level 0.8655 , which has been reversing the pair since June.

The FxPro Tech Analysis Team

The FxPro technical experts prepare a daily analysis of the most active currency pairs (majors, crosses, exotics) and commodities. Selected instruments are reviewed on daily trends (D1, H4), using the active Elliott Wave setups, Japanese candlesticks, indicators, and support/resistance levels.

Share
Published by
The FxPro Tech Analysis Team
Tags: EURGBP

Recent Posts

Nikkei 225 Wave Analysis – 4 April 2025

Nikkei 225: ⬇️ Sell - Nikkei 225 broke support zone - Likely to fall to…

2 days ago

Gold Wave Analysis – 4 April 2025

Gold: ⬇️ Sell - Gold broke daily up channel - Likely to fall to support…

2 days ago

Video Pro News Weekly

The U.S. dollar takes a major hit as trade tariffs spark capital flight, while global…

2 days ago

Mad Gold and Crude Oil

Gold experienced a significant increase followed by a sharp decline. It may be a good…

3 days ago

The US index’s demise has accelerated after confirming the downtrend

US indices fell after tough tariffs were announced by Trump, triggering a negative reaction in…

3 days ago

Tariff wars made the dollar a risky asset

The US dollar is experiencing a decline due to trade tariffs and capital flight. The…

3 days ago

This website uses cookies