Categories: Technical analysis

EURGBP Wave Analysis – 29 April, 2022

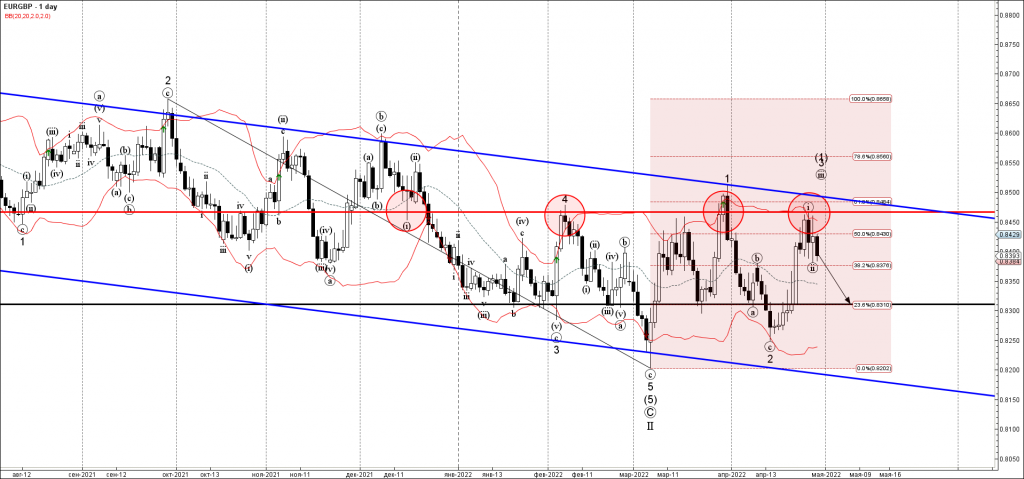
• EURGBP reversed from resistance zone
• Likely to fall to support level 0.8310

EURGBP currency pair recently reversed down from the resistance area located between the pivotal resistance level 0.8465 (which has been reversing the price from December), upper daily Bollinger Band and the resistance trendline of the down channel from last year.

This resistance zone is strengthened by the 61.8% Fibonacci correction of the downward impulse from September.

Given the clear daily downtrend – EURGBP can be expected to fall further toward the next support level 0.8310.

The FxPro Tech Analysis Team

The FxPro technical experts prepare a daily analysis of the most active currency pairs (majors, crosses, exotics) and commodities. Selected instruments are reviewed on daily trends (D1, H4), using the active Elliott Wave setups, Japanese candlesticks, indicators, and support/resistance levels.

Share
Published by
The FxPro Tech Analysis Team
Tags: EURGBP

Recent Posts

A new stage of Bitcoin’s decline 

Market Picture  Bitcoin's closing price on Tuesday became the lowest since late February, confirming the…

1 hour ago

Ebay Wave Analysis 30 April 2024

- Ebay under the bearish pressure - Likely to fall to support level 51.00 Ebay…

15 hours ago

GBPAUD Wave Analysis 30 April 2024

- GBPAUD reversed from key support level 1.9135 - Likely to rise to resistance level…

15 hours ago

Silver: a possible long road down

Silver has lost 2.6% since the start of the day on Tuesday to $26.4 per…

18 hours ago

Another Dip in Crypto Capitalization

Market picture  The crypto market capitalisation decreased by another 1.5% to $2.27 trillion, getting closer…

21 hours ago

ANF Wave Analysis 29 April 2024

ANF reversed from key support level 113.40 Likely to rise to resistance level 132.31 ANF…

2 days ago

This website uses cookies